29
/pt/
pt
AIzaSyAYiBZKx7MnpbEhh9jyipgxe19OcubqV5w
April 1, 2024
228250
Romania
ROU
true
2
1
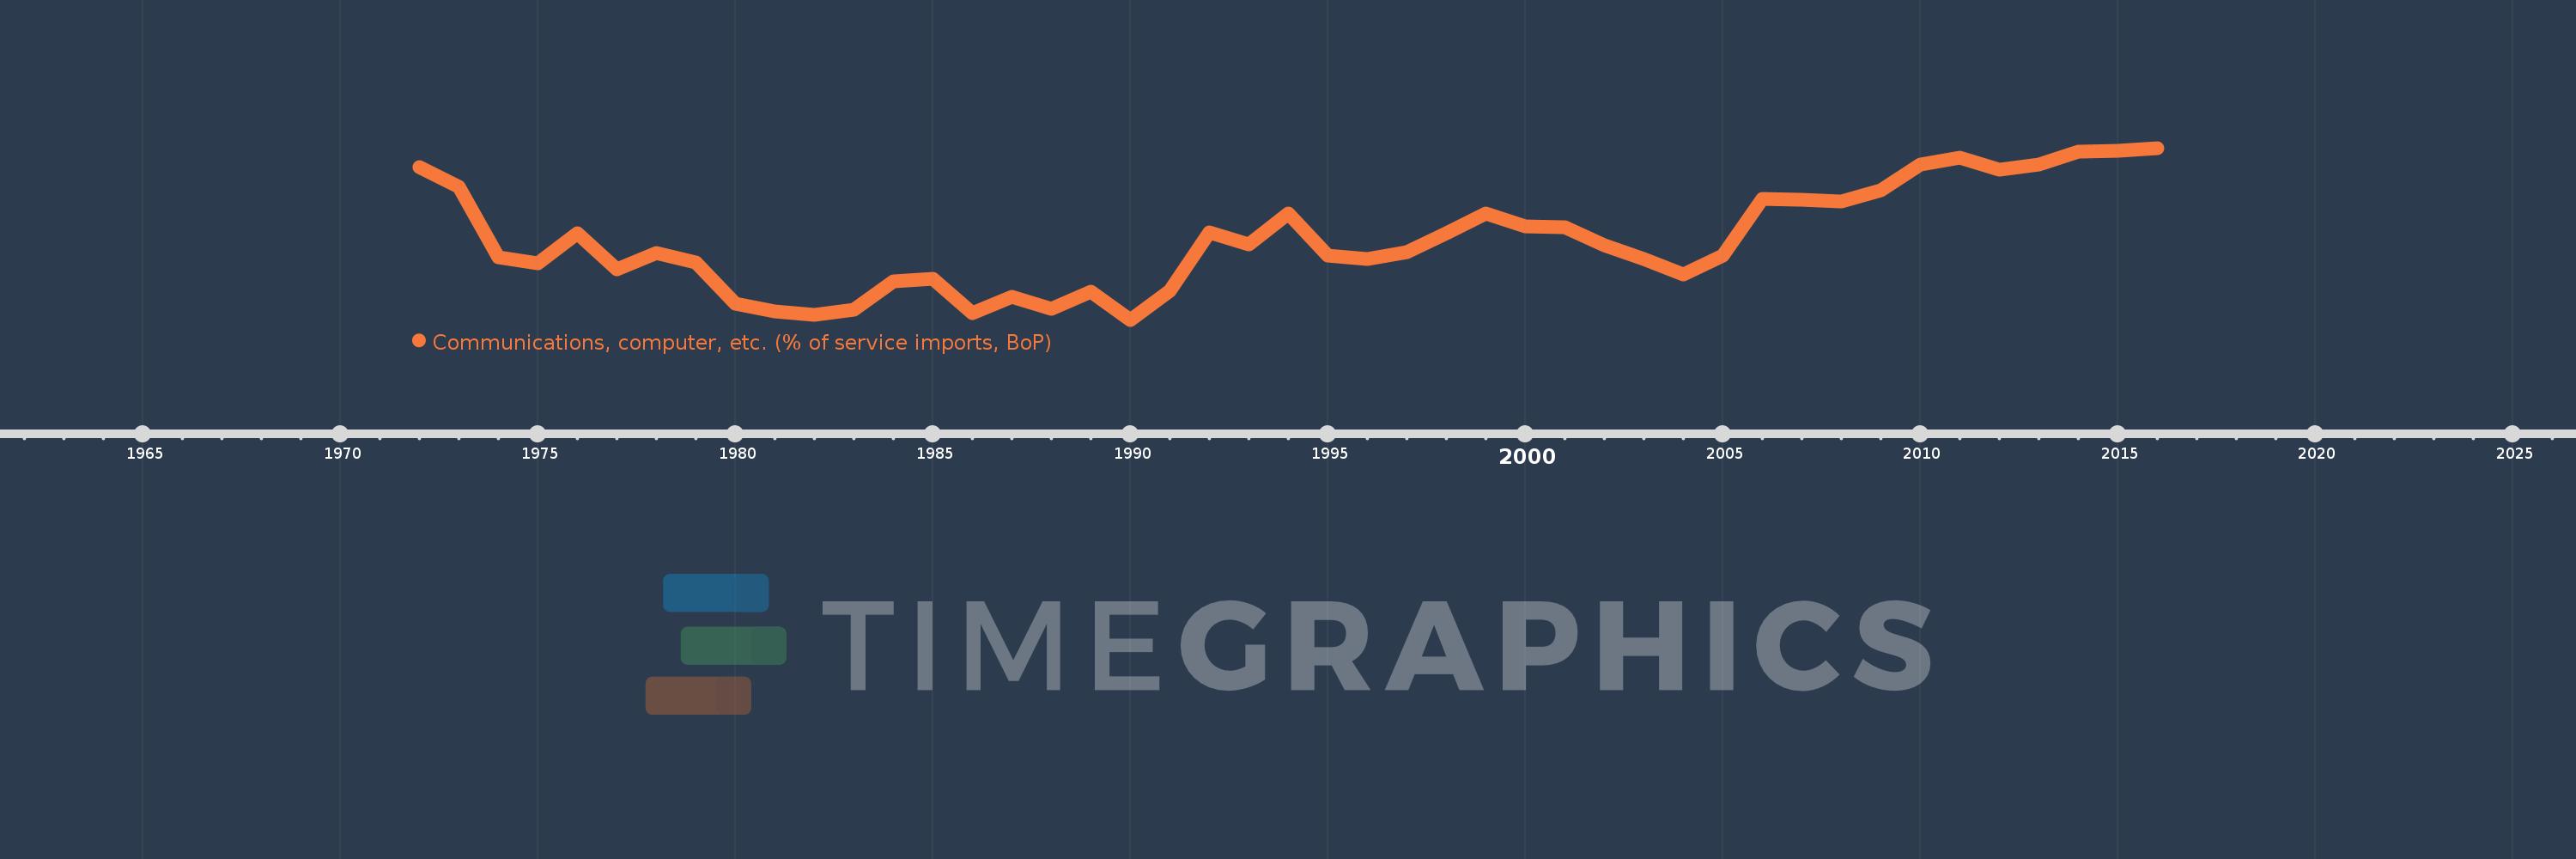
Communications, computer, etc. (% of service imports, BoP)
2016,2015,2014,2013,2012,2011,2010,2009,2008,2007,2006,2005,2004,2003,2002,2001,2000,1999,1998,1997,1996,1995,1994,1993,1992,1991,1990,1989,1988,1987,1986,1985,1984,1983,1982,1981,1980,1979,1978,1977,1976,1975,1974,1973,1972
Estas estatísticas em outros países:
AfghanistanAlbaniaAlgeriaAngolaAntigua and BarbudaArab WorldArgentinaArmeniaArubaAustraliaAustriaAzerbaijanBahamas, TheBahrainBangladeshBarbadosBelarusBelgiumBelizeBeninBermudaBhutanBoliviaBosnia and HerzegovinaBotswanaBrazilBrunei DarussalamBulgariaBurkina FasoBurundiCabo VerdeCambodiaCameroonCanadaCaribbean small statesCentral African RepublicCentral Europe and the BalticsChadChileChinaColombiaComorosCongo, Dem. Rep.Congo, Rep.Costa RicaCote d'IvoireCroatiaCuracaoCyprusCzech RepublicDenmarkDjiboutiDominicaDominican RepublicEarly-demographic dividendEast Asia & PacificEast Asia & Pacific (excluding high income)East Asia & Pacific (IDA & IBRD countries)EcuadorEgypt, Arab Rep.El SalvadorEquatorial GuineaEritreaEstoniaEthiopiaEuro areaEurope & Central AsiaEurope & Central Asia (excluding high income)Europe & Central Asia (IDA & IBRD countries)European UnionFaroe IslandsFijiFinlandFragile and conflict affected situationsFranceFrench PolynesiaGabonGambia, TheGeorgiaGermanyGhanaGreeceGrenadaGuatemalaGuineaGuinea-BissauGuyanaHaitiHeavily indebted poor countries (HIPC)High incomeHondurasHong Kong SAR, ChinaHungaryIBRD onlyIcelandIDA & IBRD totalIDA onlyIDA totalIndiaIndonesiaIran, Islamic Rep.IraqIrelandIsraelItalyJamaicaJapanJordanKazakhstanKenyaKiribatiKorea, Rep.KosovoKuwaitKyrgyz RepublicLao PDRLate-demographic dividendLatin America & Caribbean Latin America & Caribbean (excluding high income)Latin America & the Caribbean (IDA & IBRD countries)LatviaLeast developed countries: UN classificationLebanonLesothoLiberiaLibyaLithuaniaLow & middle incomeLow incomeLower middle incomeLuxembourgMacao SAR, ChinaMacedonia, FYRMadagascarMalawiMalaysiaMaldivesMaliMaltaMarshall IslandsMauritaniaMauritiusMexicoMicronesia, Fed. Sts.Middle East & North AfricaMiddle East & North Africa (excluding high income)Middle East & North Africa (IDA & IBRD countries)Middle incomeMoldovaMongoliaMontenegroMoroccoMozambiqueMyanmarNamibiaNepalNetherlandsNew CaledoniaNew ZealandNicaraguaNigerNigeriaNorth AmericaNorwayOECD membersOmanOther small statesPacific island small statesPakistanPalauPanamaPapua New GuineaParaguayPeruPhilippinesPolandPortugalPost-demographic dividendPre-demographic dividendQatarRomaniaRussian FederationRwandaSamoaSao Tome and PrincipeSaudi ArabiaSenegalSerbiaSeychellesSierra LeoneSingaporeSint Maarten (Dutch part)Slovak RepublicSloveniaSmall statesSolomon IslandsSouth AfricaSouth AsiaSouth Asia (IDA & IBRD)South SudanSpainSri LankaSt. Kitts and NevisSt. LuciaSt. Vincent and the GrenadinesSub-Saharan Africa Sub-Saharan Africa (excluding high income)Sub-Saharan Africa (IDA & IBRD countries)SudanSurinameSwazilandSwedenSwitzerlandSyrian Arab RepublicTajikistanTanzaniaThailandTimor-LesteTogoTongaTrinidad and TobagoTunisiaTurkeyTuvaluUgandaUkraineUnited KingdomUnited StatesUpper middle incomeUruguayVanuatuVenezuela, RBWest Bank and GazaWorldYemen, Rep.ZambiaZimbabwe Linha do tempo:
Nesta escala de tempo está apresentado um gráfico de 1972 ano até 2016 ano Romania. Dados de 1971 ano ausente. O número de observações reais por data: 45.
Fonte (nome):
Indicadores de desenvolvimento mundial
Fonte (organização):
International Monetary Fund, Balance of Payments Statistics Yearbook and data files.
Categorias:
Economy & Growth, Trade
Foi atualizado:
23 abr 2017 ano
Indicadores de alterações dos valores ao longo dos anos
Mínimo:
5.111
1 jan 1990 ano
Máximo:
57.721
1 jan 2016 ano
Na data de observação
Valor
Mudança absoluta
A alteração em relação ao valor anterior
1 jan 1972 ano
51.815
+51.815
0.0%
1 jan 1973 ano
45.763
-6.052
-11.68%
1 jan 1974 ano
24.129
-21.634
-47.27%
1 jan 1975 ano
22.394
-1.735
-7.19%
1 jan 1976 ano
31.589
+9.195
41.06%
1 jan 1977 ano
20.53
-11.059
-35.01%
1 jan 1978 ano
25.617
+5.087
24.78%
1 jan 1979 ano
22.721
-2.896
-11.31%
1 jan 1980 ano
10.011
-12.71
-55.94%
1 jan 1981 ano
7.656
-2.355
-23.53%
1 jan 1982 ano
6.509
-1.147
-14.98%
1 jan 1983 ano
8.155
+1.646
25.29%
1 jan 1984 ano
16.942
+8.787
107.75%
1 jan 1985 ano
17.571
+0.629
3.71%
1 jan 1986 ano
7.061
-10.51
-59.81%
1 jan 1987 ano
12.028
+4.967
70.35%
1 jan 1988 ano
8.35
-3.679
-30.58%
1 jan 1989 ano
13.75
+5.4
64.68%
1 jan 1990 ano
5.111
-8.639
-62.83%
1 jan 1991 ano
14.104
+8.993
175.95%
1 jan 1992 ano
31.868
+17.764
125.95%
1 jan 1993 ano
28.224
-3.644
-11.43%
1 jan 1994 ano
37.637
+9.413
33.35%
1 jan 1995 ano
24.877
-12.76
-33.9%
1 jan 1996 ano
23.745
-1.133
-4.55%
1 jan 1997 ano
25.935
+2.191
9.23%
1 jan 1998 ano
31.554
+5.619
21.66%
1 jan 1999 ano
37.745
+6.191
19.62%
1 jan 2000 ano
33.665
-4.081
-10.81%
1 jan 2001 ano
33.538
-0.127
-0.38%
1 jan 2002 ano
27.793
-5.745
-17.13%
1 jan 2003 ano
23.838
-3.955
-14.23%
1 jan 2004 ano
19.084
-4.755
-19.95%
1 jan 2005 ano
24.801
+5.717
29.96%
1 jan 2006 ano
42.119
+17.318
69.83%
1 jan 2007 ano
41.893
-0.226
-0.54%
1 jan 2008 ano
41.27
-0.623
-1.49%
1 jan 2009 ano
44.734
+3.464
8.39%
1 jan 2010 ano
52.58
+7.845
17.54%
1 jan 2011 ano
54.852
+2.272
4.32%
1 jan 2012 ano
50.969
-3.883
-7.08%
1 jan 2013 ano
52.668
+1.699
3.33%
1 jan 2014 ano
56.633
+3.965
7.53%
1 jan 2015 ano
56.913
+0.28
0.49%
1 jan 2016 ano
57.721
+0.809
1.42%
Classificação de países por estatísticas atuais por anos


Comentários: