29
/pt/
pt
AIzaSyAYiBZKx7MnpbEhh9jyipgxe19OcubqV5w
April 1, 2024
57937
South Asia (IDA & IBRD)
TSA
false
2
1
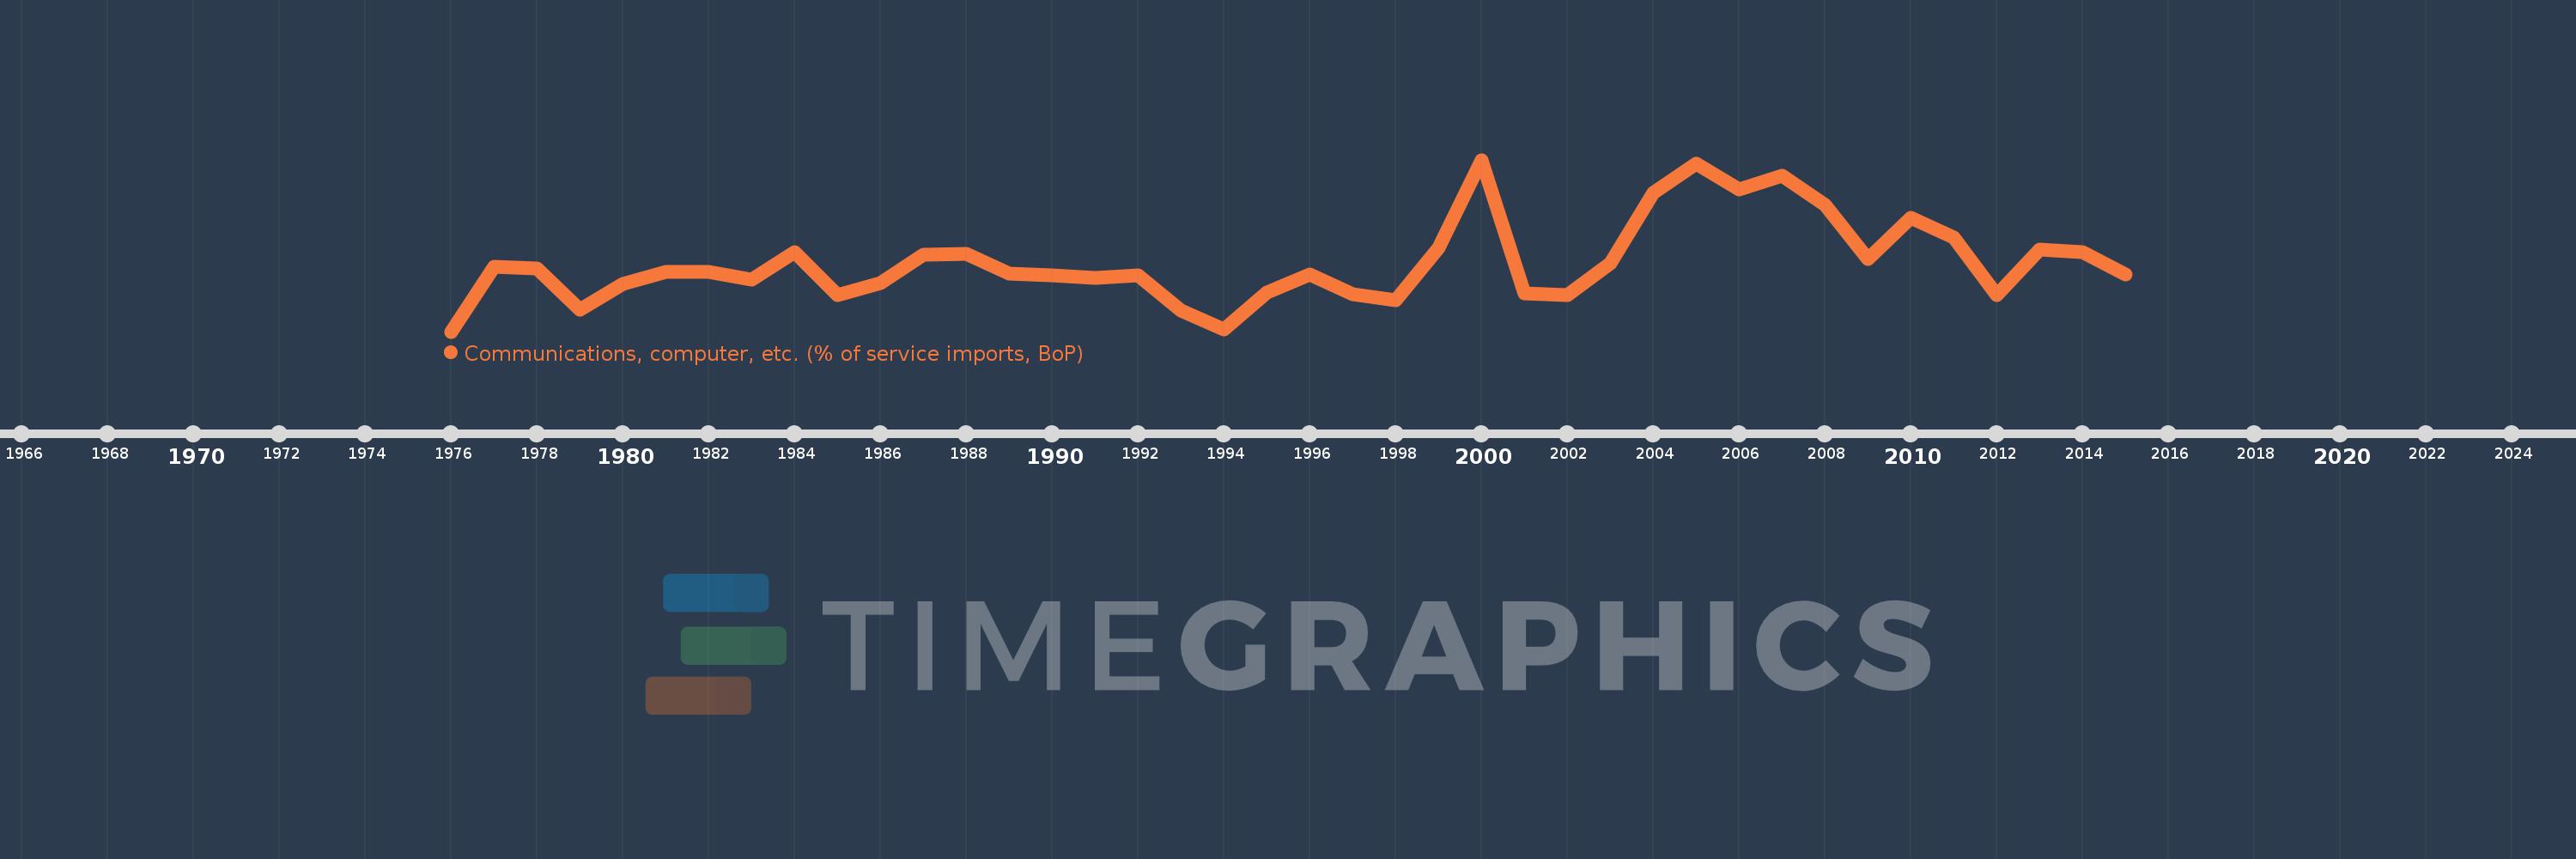
Communications, computer, etc. (% of service imports, BoP)
2015,2014,2013,2012,2011,2010,2009,2008,2007,2006,2005,2004,2003,2002,2001,2000,1999,1998,1997,1996,1995,1994,1993,1992,1991,1990,1989,1988,1987,1986,1985,1984,1983,1982,1981,1980,1979,1978,1977,1976
Estas estatísticas em outros países:
AfghanistanAlbaniaAlgeriaAngolaAntigua and BarbudaArab WorldArgentinaArmeniaArubaAustraliaAustriaAzerbaijanBahamas, TheBahrainBangladeshBarbadosBelarusBelgiumBelizeBeninBermudaBhutanBoliviaBosnia and HerzegovinaBotswanaBrazilBrunei DarussalamBulgariaBurkina FasoBurundiCabo VerdeCambodiaCameroonCanadaCaribbean small statesCentral African RepublicCentral Europe and the BalticsChadChileChinaColombiaComorosCongo, Dem. Rep.Congo, Rep.Costa RicaCote d'IvoireCroatiaCuracaoCyprusCzech RepublicDenmarkDjiboutiDominicaDominican RepublicEarly-demographic dividendEast Asia & PacificEast Asia & Pacific (excluding high income)East Asia & Pacific (IDA & IBRD countries)EcuadorEgypt, Arab Rep.El SalvadorEquatorial GuineaEritreaEstoniaEthiopiaEuro areaEurope & Central AsiaEurope & Central Asia (excluding high income)Europe & Central Asia (IDA & IBRD countries)European UnionFaroe IslandsFijiFinlandFragile and conflict affected situationsFranceFrench PolynesiaGabonGambia, TheGeorgiaGermanyGhanaGreeceGrenadaGuatemalaGuineaGuinea-BissauGuyanaHaitiHeavily indebted poor countries (HIPC)High incomeHondurasHong Kong SAR, ChinaHungaryIBRD onlyIcelandIDA & IBRD totalIDA onlyIDA totalIndiaIndonesiaIran, Islamic Rep.IraqIrelandIsraelItalyJamaicaJapanJordanKazakhstanKenyaKiribatiKorea, Rep.KosovoKuwaitKyrgyz RepublicLao PDRLate-demographic dividendLatin America & Caribbean Latin America & Caribbean (excluding high income)Latin America & the Caribbean (IDA & IBRD countries)LatviaLeast developed countries: UN classificationLebanonLesothoLiberiaLibyaLithuaniaLow & middle incomeLow incomeLower middle incomeLuxembourgMacao SAR, ChinaMacedonia, FYRMadagascarMalawiMalaysiaMaldivesMaliMaltaMarshall IslandsMauritaniaMauritiusMexicoMicronesia, Fed. Sts.Middle East & North AfricaMiddle East & North Africa (excluding high income)Middle East & North Africa (IDA & IBRD countries)Middle incomeMoldovaMongoliaMontenegroMoroccoMozambiqueMyanmarNamibiaNepalNetherlandsNew CaledoniaNew ZealandNicaraguaNigerNigeriaNorth AmericaNorwayOECD membersOmanOther small statesPacific island small statesPakistanPalauPanamaPapua New GuineaParaguayPeruPhilippinesPolandPortugalPost-demographic dividendPre-demographic dividendQatarRomaniaRussian FederationRwandaSamoaSao Tome and PrincipeSaudi ArabiaSenegalSerbiaSeychellesSierra LeoneSingaporeSint Maarten (Dutch part)Slovak RepublicSloveniaSmall statesSolomon IslandsSouth AfricaSouth AsiaSouth Asia (IDA & IBRD)South SudanSpainSri LankaSt. Kitts and NevisSt. LuciaSt. Vincent and the GrenadinesSub-Saharan Africa Sub-Saharan Africa (excluding high income)Sub-Saharan Africa (IDA & IBRD countries)SudanSurinameSwazilandSwedenSwitzerlandSyrian Arab RepublicTajikistanTanzaniaThailandTimor-LesteTogoTongaTrinidad and TobagoTunisiaTurkeyTuvaluUgandaUkraineUnited KingdomUnited StatesUpper middle incomeUruguayVanuatuVenezuela, RBWest Bank and GazaWorldYemen, Rep.ZambiaZimbabwe Linha do tempo:
Nesta escala de tempo está apresentado um gráfico de 1976 ano até 2015 ano South Asia (IDA & IBRD). Dados de 1975 ano ausente. O número de observações reais por data: 40.
Fonte (nome):
Indicadores de desenvolvimento mundial
Fonte (organização):
International Monetary Fund, Balance of Payments Statistics Yearbook and data files.
Categorias:
Economy & Growth, Trade
Foi atualizado:
23 abr 2017 ano
Indicadores de alterações dos valores ao longo dos anos
Mínimo:
22.789
1 jan 1976 ano
Máximo:
38.179
1 jan 2000 ano
Na data de observação
Valor
Mudança absoluta
A alteração em relação ao valor anterior
1 jan 1976 ano
22.789
+22.789
0.0%
1 jan 1977 ano
28.604
+5.815
25.52%
1 jan 1978 ano
28.444
-0.159
-0.56%
1 jan 1979 ano
24.77
-3.674
-12.92%
1 jan 1980 ano
27.031
+2.261
9.13%
1 jan 1981 ano
28.111
+1.081
4.0%
1 jan 1982 ano
28.138
+0.027
0.09%
1 jan 1983 ano
27.422
-0.715
-2.54%
1 jan 1984 ano
29.942
+2.519
9.19%
1 jan 1985 ano
26.047
-3.895
-13.01%
1 jan 1986 ano
27.167
+1.12
4.3%
1 jan 1987 ano
29.694
+2.527
9.3%
1 jan 1988 ano
29.77
+0.077
0.26%
1 jan 1989 ano
28.008
-1.762
-5.92%
1 jan 1990 ano
27.844
-0.164
-0.58%
1 jan 1991 ano
27.56
-0.284
-1.02%
1 jan 1992 ano
27.8
+0.24
0.87%
1 jan 1993 ano
24.704
-3.097
-11.14%
1 jan 1994 ano
22.969
-1.735
-7.02%
1 jan 1995 ano
26.324
+3.355
14.61%
1 jan 1996 ano
27.912
+1.588
6.03%
1 jan 1997 ano
26.172
-1.74
-6.23%
1 jan 1998 ano
25.589
-0.582
-2.22%
1 jan 1999 ano
30.307
+4.717
18.43%
1 jan 2000 ano
38.179
+7.872
25.98%
1 jan 2001 ano
26.245
-11.934
-31.26%
1 jan 2002 ano
26.053
-0.192
-0.73%
1 jan 2003 ano
28.894
+2.841
10.9%
1 jan 2004 ano
35.202
+6.307
21.83%
1 jan 2005 ano
37.799
+2.597
7.38%
1 jan 2006 ano
35.502
-2.297
-6.08%
1 jan 2007 ano
36.731
+1.228
3.46%
1 jan 2008 ano
34.106
-2.625
-7.15%
1 jan 2009 ano
29.302
-4.804
-14.08%
1 jan 2010 ano
32.992
+3.689
12.59%
1 jan 2011 ano
31.203
-1.789
-5.42%
1 jan 2012 ano
26.05
-5.153
-16.51%
1 jan 2013 ano
30.167
+4.116
15.8%
1 jan 2014 ano
29.907
-0.259
-0.86%
1 jan 2015 ano
27.918
-1.99
-6.65%
Classificação de países por estatísticas atuais por anos


Comentários: