29
/pt/
pt
AIzaSyAYiBZKx7MnpbEhh9jyipgxe19OcubqV5w
April 1, 2024
57850
South Asia (IDA & IBRD)
TSA
false
2
1
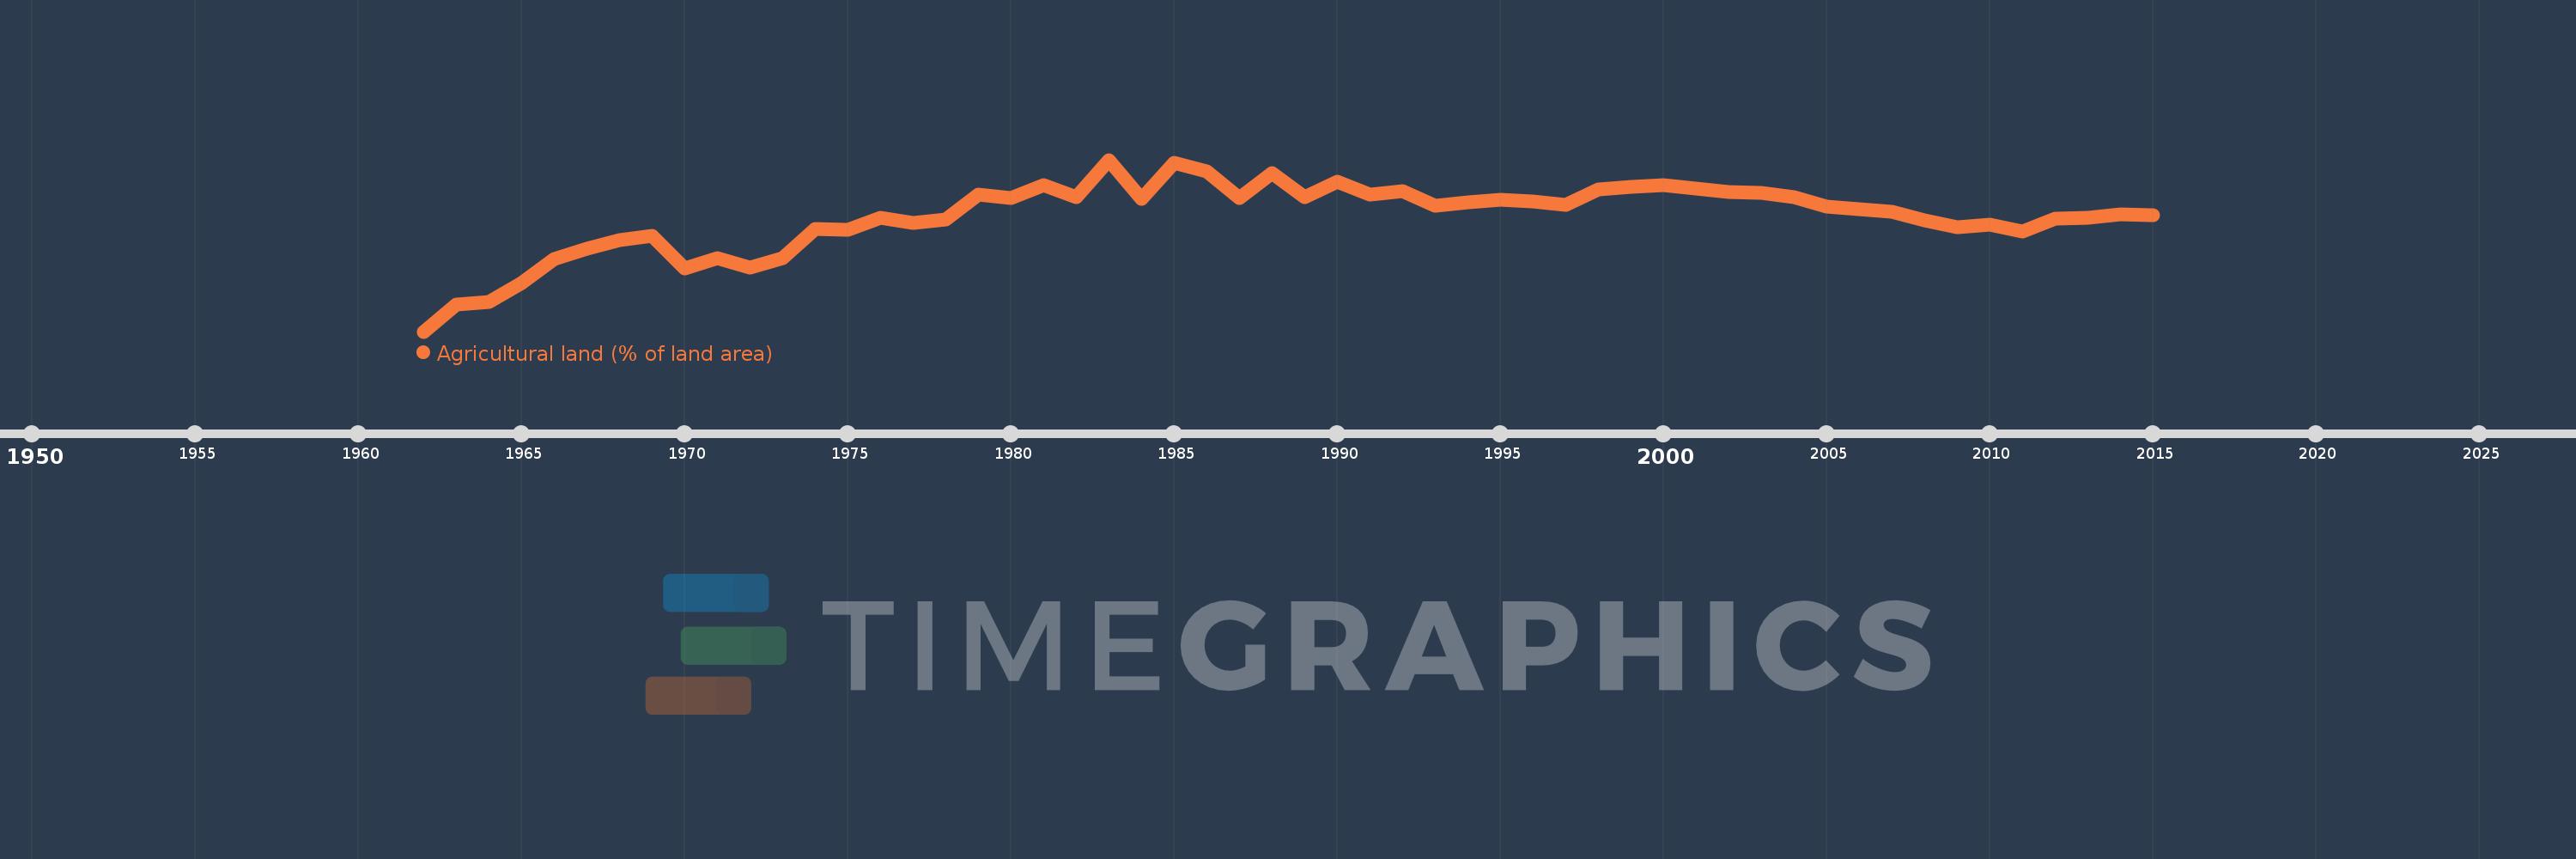
Agricultural land (% of land area)
2015,2014,2013,2012,2011,2010,2009,2008,2007,2006,2005,2004,2003,2002,2001,2000,1999,1998,1997,1996,1995,1994,1993,1992,1991,1990,1989,1988,1987,1986,1985,1984,1983,1982,1981,1980,1979,1978,1977,1976,1975,1974,1973,1972,1971,1970,1969,1968,1967,1966,1965,1964,1963,1962
Estas estatísticas em outros países:
AfghanistanAlbaniaAlgeriaAmerican SamoaAndorraAngolaAntigua and BarbudaArab WorldArgentinaArmeniaArubaAustraliaAustriaAzerbaijanBahamas, TheBahrainBangladeshBarbadosBelarusBelgiumBelizeBeninBermudaBhutanBoliviaBosnia and HerzegovinaBotswanaBrazilBritish Virgin IslandsBrunei DarussalamBulgariaBurkina FasoBurundiCabo VerdeCambodiaCameroonCanadaCaribbean small statesCayman IslandsCentral African RepublicCentral Europe and the BalticsChadChannel IslandsChileChinaColombiaComorosCongo, Dem. Rep.Congo, Rep.Costa RicaCote d'IvoireCroatiaCubaCyprusCzech RepublicDenmarkDjiboutiDominicaDominican RepublicEarly-demographic dividendEast Asia & PacificEast Asia & Pacific (excluding high income)East Asia & Pacific (IDA & IBRD countries)EcuadorEgypt, Arab Rep.El SalvadorEquatorial GuineaEritreaEstoniaEthiopiaEuro areaEurope & Central AsiaEurope & Central Asia (excluding high income)Europe & Central Asia (IDA & IBRD countries)European UnionFaroe IslandsFijiFinlandFragile and conflict affected situationsFranceFrench PolynesiaGabonGambia, TheGeorgiaGermanyGhanaGreeceGreenlandGrenadaGuamGuatemalaGuineaGuinea-BissauGuyanaHaitiHeavily indebted poor countries (HIPC)High incomeHondurasHong Kong SAR, ChinaHungaryIBRD onlyIcelandIDA & IBRD totalIDA blendIDA onlyIDA totalIndiaIndonesiaIran, Islamic Rep.IraqIrelandIsle of ManIsraelItalyJamaicaJapanJordanKazakhstanKenyaKiribatiKorea, Dem. People’s Rep.Korea, Rep.KosovoKuwaitKyrgyz RepublicLao PDRLate-demographic dividendLatin America & Caribbean Latin America & Caribbean (excluding high income)Latin America & the Caribbean (IDA & IBRD countries)LatviaLeast developed countries: UN classificationLebanonLesothoLiberiaLibyaLiechtensteinLithuaniaLow & middle incomeLow incomeLower middle incomeLuxembourgMacedonia, FYRMadagascarMalawiMalaysiaMaldivesMaliMaltaMarshall IslandsMauritaniaMauritiusMexicoMicronesia, Fed. Sts.Middle East & North AfricaMiddle East & North Africa (excluding high income)Middle East & North Africa (IDA & IBRD countries)Middle incomeMoldovaMongoliaMontenegroMoroccoMozambiqueMyanmarNamibiaNauruNepalNetherlandsNew CaledoniaNew ZealandNicaraguaNigerNigeriaNorth AmericaNorthern Mariana IslandsNorwayOECD membersOmanOther small statesPacific island small statesPakistanPalauPanamaPapua New GuineaParaguayPeruPhilippinesPolandPortugalPost-demographic dividendPre-demographic dividendPuerto RicoQatarRomaniaRussian FederationRwandaSamoaSan MarinoSao Tome and PrincipeSaudi ArabiaSenegalSerbiaSeychellesSierra LeoneSingaporeSlovak RepublicSloveniaSmall statesSolomon IslandsSomaliaSouth AfricaSouth AsiaSouth Asia (IDA & IBRD)SpainSri LankaSt. Kitts and NevisSt. LuciaSt. Vincent and the GrenadinesSub-Saharan Africa Sub-Saharan Africa (excluding high income)Sub-Saharan Africa (IDA & IBRD countries)SudanSurinameSwazilandSwedenSwitzerlandSyrian Arab RepublicTajikistanTanzaniaThailandTimor-LesteTogoTongaTrinidad and TobagoTunisiaTurkeyTurkmenistanTurks and Caicos IslandsTuvaluUgandaUkraineUnited Arab EmiratesUnited KingdomUnited StatesUpper middle incomeUruguayUzbekistanVanuatuVenezuela, RBVietnamVirgin Islands (U.S.)West Bank and GazaWorldYemen, Rep.ZambiaZimbabwe Linha do tempo:
Nesta escala de tempo está apresentado um gráfico de 1962 ano até 2015 ano South Asia (IDA & IBRD). Dados de 1961 ano ausente. O número de observações reais por data: 54.
Fonte (nome):
Indicadores de desenvolvimento mundial
Fonte (organização):
Food and Agriculture Organization, electronic files and web site.
Categorias:
Agriculture & Rural Development, Climate Change, Environment
Foi atualizado:
23 abr 2017 ano
Indicadores de alterações dos valores ao longo dos anos
Mínimo:
55.128
1 jan 1962 ano
Máximo:
57.354
1 jan 1983 ano
Na data de observação
Valor
Mudança absoluta
A alteração em relação ao valor anterior
1 jan 1962 ano
55.128
+55.128
0.0%
1 jan 1963 ano
55.48
+0.352
0.64%
1 jan 1964 ano
55.507
+0.027
0.05%
1 jan 1965 ano
55.752
+0.245
0.44%
1 jan 1966 ano
56.07
+0.318
0.57%
1 jan 1967 ano
56.203
+0.133
0.24%
1 jan 1968 ano
56.309
+0.106
0.19%
1 jan 1969 ano
56.371
+0.063
0.11%
1 jan 1970 ano
55.95
-0.421
-0.75%
1 jan 1971 ano
56.078
+0.127
0.23%
1 jan 1972 ano
55.956
-0.121
-0.22%
1 jan 1973 ano
56.079
+0.122
0.22%
1 jan 1974 ano
56.463
+0.385
0.69%
1 jan 1975 ano
56.447
-0.016
-0.03%
1 jan 1976 ano
56.602
+0.155
0.27%
1 jan 1977 ano
56.536
-0.066
-0.12%
1 jan 1978 ano
56.576
+0.04
0.07%
1 jan 1979 ano
56.901
+0.325
0.57%
1 jan 1980 ano
56.862
-0.039
-0.07%
1 jan 1981 ano
57.027
+0.165
0.29%
1 jan 1982 ano
56.866
-0.16
-0.28%
1 jan 1983 ano
57.354
+0.487
0.86%
1 jan 1984 ano
56.852
-0.501
-0.87%
1 jan 1985 ano
57.312
+0.46
0.81%
1 jan 1986 ano
57.203
-0.109
-0.19%
1 jan 1987 ano
56.857
-0.346
-0.61%
1 jan 1988 ano
57.181
+0.324
0.57%
1 jan 1989 ano
56.874
-0.307
-0.54%
1 jan 1990 ano
57.07
+0.196
0.34%
1 jan 1991 ano
56.904
-0.166
-0.29%
1 jan 1992 ano
56.949
+0.045
0.08%
1 jan 1993 ano
56.755
-0.194
-0.34%
1 jan 1994 ano
56.804
+0.049
0.09%
1 jan 1995 ano
56.836
+0.032
0.06%
1 jan 1996 ano
56.818
-0.018
-0.03%
1 jan 1997 ano
56.768
-0.05
-0.09%
1 jan 1998 ano
56.973
+0.205
0.36%
1 jan 1999 ano
57.003
+0.03
0.05%
1 jan 2000 ano
57.026
+0.023
0.04%
1 jan 2001 ano
56.977
-0.049
-0.09%
1 jan 2002 ano
56.936
-0.041
-0.07%
1 jan 2003 ano
56.92
-0.016
-0.03%
1 jan 2004 ano
56.874
-0.046
-0.08%
1 jan 2005 ano
56.748
-0.126
-0.22%
1 jan 2006 ano
56.716
-0.032
-0.06%
1 jan 2007 ano
56.677
-0.039
-0.07%
1 jan 2008 ano
56.572
-0.106
-0.19%
1 jan 2009 ano
56.482
-0.089
-0.16%
1 jan 2010 ano
56.518
+0.036
0.06%
1 jan 2011 ano
56.426
-0.092
-0.16%
1 jan 2012 ano
56.591
+0.165
0.29%
1 jan 2013 ano
56.6
+0.009
0.02%
1 jan 2014 ano
56.648
+0.047
0.08%
1 jan 2015 ano
56.639
-0.009
-0.02%
Classificação de países por estatísticas atuais por anos


Comentários: