29
/pt/
pt
AIzaSyAYiBZKx7MnpbEhh9jyipgxe19OcubqV5w
April 1, 2024
167085
Kenya
KEN
true
2
1
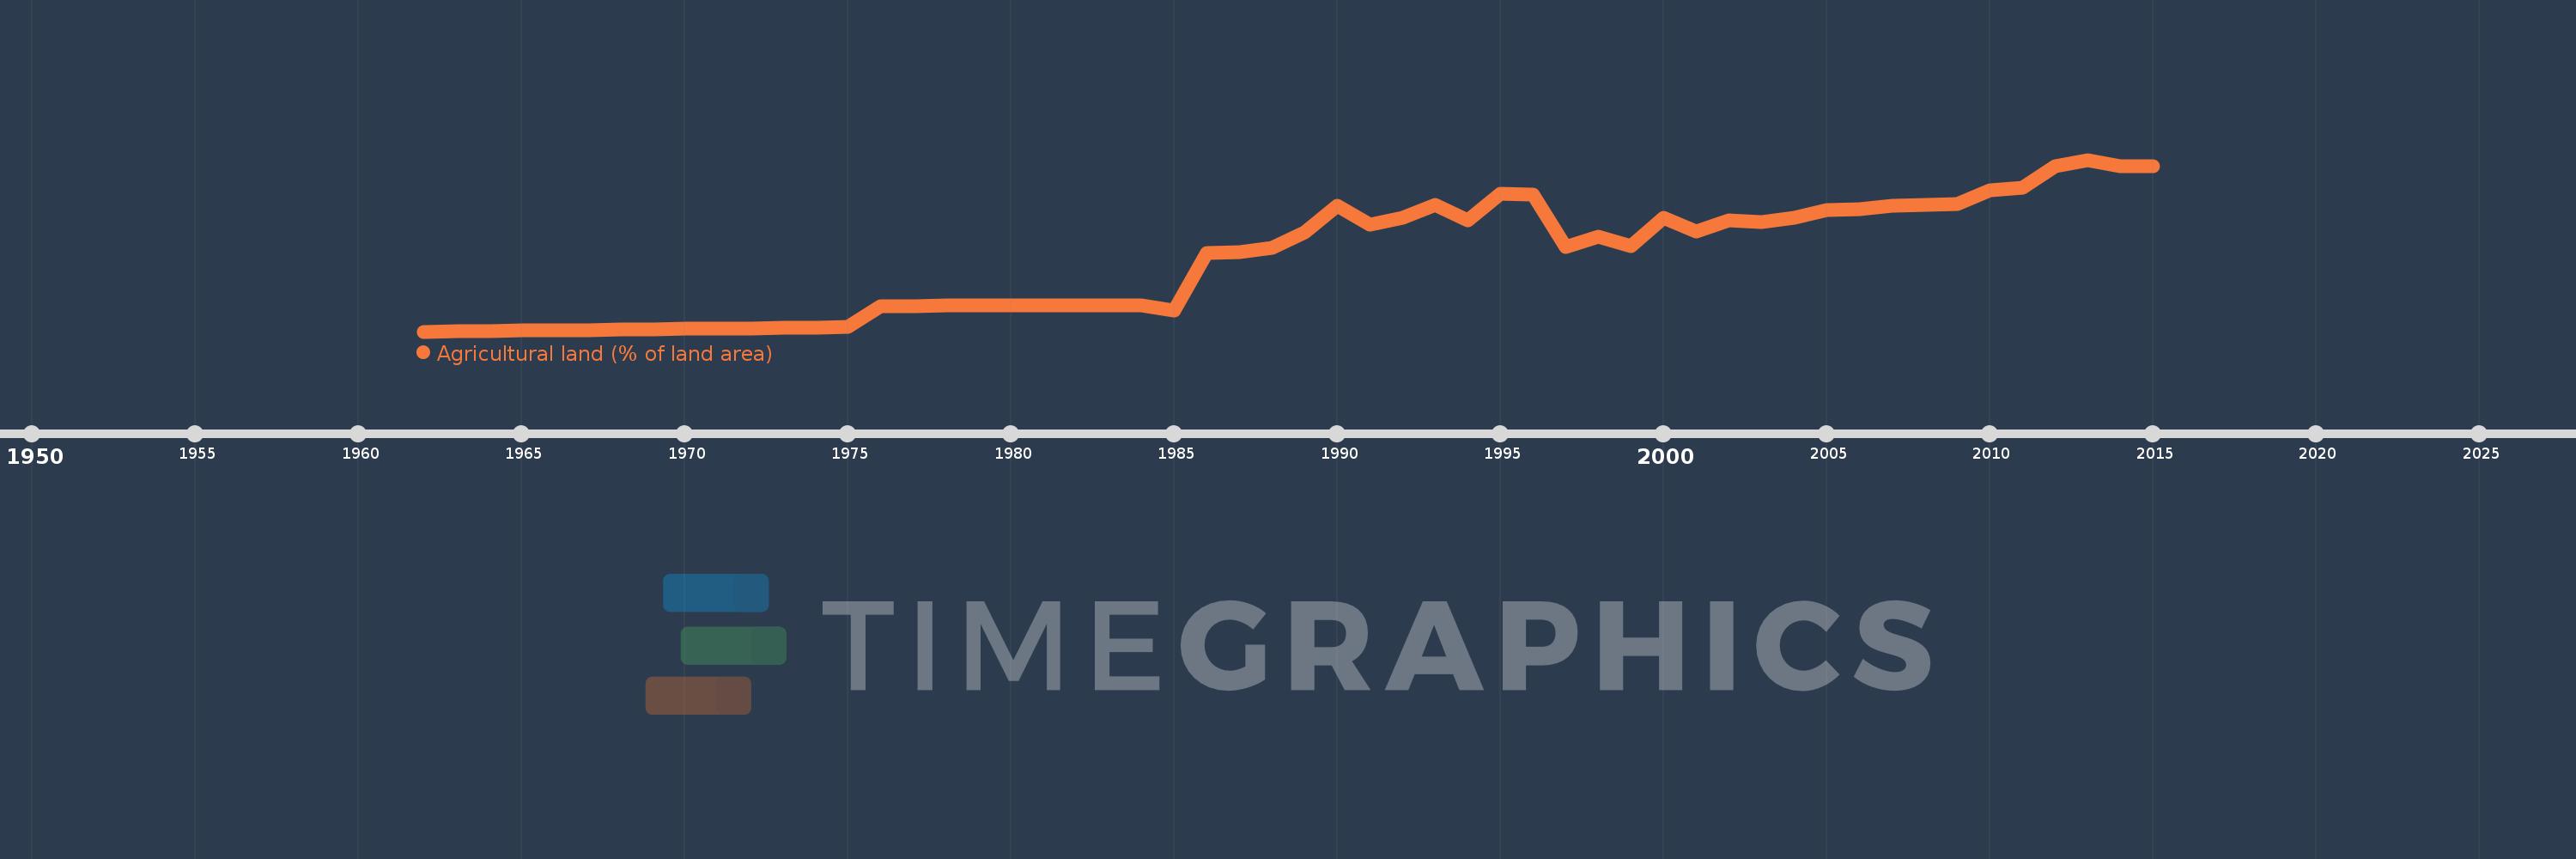
Agricultural land (% of land area)
2015,2014,2013,2012,2011,2010,2009,2008,2007,2006,2005,2004,2003,2002,2001,2000,1999,1998,1997,1996,1995,1994,1993,1992,1991,1990,1989,1988,1987,1986,1985,1984,1983,1982,1981,1980,1979,1978,1977,1976,1975,1974,1973,1972,1971,1970,1969,1968,1967,1966,1965,1964,1963,1962
Estas estatísticas em outros países:
AfghanistanAlbaniaAlgeriaAmerican SamoaAndorraAngolaAntigua and BarbudaArab WorldArgentinaArmeniaArubaAustraliaAustriaAzerbaijanBahamas, TheBahrainBangladeshBarbadosBelarusBelgiumBelizeBeninBermudaBhutanBoliviaBosnia and HerzegovinaBotswanaBrazilBritish Virgin IslandsBrunei DarussalamBulgariaBurkina FasoBurundiCabo VerdeCambodiaCameroonCanadaCaribbean small statesCayman IslandsCentral African RepublicCentral Europe and the BalticsChadChannel IslandsChileChinaColombiaComorosCongo, Dem. Rep.Congo, Rep.Costa RicaCote d'IvoireCroatiaCubaCyprusCzech RepublicDenmarkDjiboutiDominicaDominican RepublicEarly-demographic dividendEast Asia & PacificEast Asia & Pacific (excluding high income)East Asia & Pacific (IDA & IBRD countries)EcuadorEgypt, Arab Rep.El SalvadorEquatorial GuineaEritreaEstoniaEthiopiaEuro areaEurope & Central AsiaEurope & Central Asia (excluding high income)Europe & Central Asia (IDA & IBRD countries)European UnionFaroe IslandsFijiFinlandFragile and conflict affected situationsFranceFrench PolynesiaGabonGambia, TheGeorgiaGermanyGhanaGreeceGreenlandGrenadaGuamGuatemalaGuineaGuinea-BissauGuyanaHaitiHeavily indebted poor countries (HIPC)High incomeHondurasHong Kong SAR, ChinaHungaryIBRD onlyIcelandIDA & IBRD totalIDA blendIDA onlyIDA totalIndiaIndonesiaIran, Islamic Rep.IraqIrelandIsle of ManIsraelItalyJamaicaJapanJordanKazakhstanKenyaKiribatiKorea, Dem. People’s Rep.Korea, Rep.KosovoKuwaitKyrgyz RepublicLao PDRLate-demographic dividendLatin America & Caribbean Latin America & Caribbean (excluding high income)Latin America & the Caribbean (IDA & IBRD countries)LatviaLeast developed countries: UN classificationLebanonLesothoLiberiaLibyaLiechtensteinLithuaniaLow & middle incomeLow incomeLower middle incomeLuxembourgMacedonia, FYRMadagascarMalawiMalaysiaMaldivesMaliMaltaMarshall IslandsMauritaniaMauritiusMexicoMicronesia, Fed. Sts.Middle East & North AfricaMiddle East & North Africa (excluding high income)Middle East & North Africa (IDA & IBRD countries)Middle incomeMoldovaMongoliaMontenegroMoroccoMozambiqueMyanmarNamibiaNauruNepalNetherlandsNew CaledoniaNew ZealandNicaraguaNigerNigeriaNorth AmericaNorthern Mariana IslandsNorwayOECD membersOmanOther small statesPacific island small statesPakistanPalauPanamaPapua New GuineaParaguayPeruPhilippinesPolandPortugalPost-demographic dividendPre-demographic dividendPuerto RicoQatarRomaniaRussian FederationRwandaSamoaSan MarinoSao Tome and PrincipeSaudi ArabiaSenegalSerbiaSeychellesSierra LeoneSingaporeSlovak RepublicSloveniaSmall statesSolomon IslandsSomaliaSouth AfricaSouth AsiaSouth Asia (IDA & IBRD)SpainSri LankaSt. Kitts and NevisSt. LuciaSt. Vincent and the GrenadinesSub-Saharan Africa Sub-Saharan Africa (excluding high income)Sub-Saharan Africa (IDA & IBRD countries)SudanSurinameSwazilandSwedenSwitzerlandSyrian Arab RepublicTajikistanTanzaniaThailandTimor-LesteTogoTongaTrinidad and TobagoTunisiaTurkeyTurkmenistanTurks and Caicos IslandsTuvaluUgandaUkraineUnited Arab EmiratesUnited KingdomUnited StatesUpper middle incomeUruguayUzbekistanVanuatuVenezuela, RBVietnamVirgin Islands (U.S.)West Bank and GazaWorldYemen, Rep.ZambiaZimbabwe Linha do tempo:
Nesta escala de tempo está apresentado um gráfico de 1962 ano até 2015 ano Kenya. Dados de 1961 ano ausente. O número de observações reais por data: 54.
Fonte (nome):
Indicadores de desenvolvimento mundial
Fonte (organização):
Food and Agriculture Organization, electronic files and web site.
Categorias:
Agriculture & Rural Development, Climate Change, Environment
Foi atualizado:
23 abr 2017 ano
Indicadores de alterações dos valores ao longo dos anos
Mínimo:
44.277
1 jan 1962 ano
Máximo:
48.723
1 jan 2013 ano
Na data de observação
Valor
Mudança absoluta
A alteração em relação ao valor anterior
1 jan 1962 ano
44.277
+44.277
0.0%
1 jan 1963 ano
44.286
+0.009
0.02%
1 jan 1964 ano
44.295
+0.009
0.02%
1 jan 1965 ano
44.304
+0.009
0.02%
1 jan 1966 ano
44.312
+0.009
0.02%
1 jan 1967 ano
44.321
+0.009
0.02%
1 jan 1968 ano
44.33
+0.009
0.02%
1 jan 1969 ano
44.339
+0.009
0.02%
1 jan 1970 ano
44.348
+0.009
0.02%
1 jan 1971 ano
44.356
+0.009
0.02%
1 jan 1972 ano
44.365
+0.009
0.02%
1 jan 1973 ano
44.374
+0.009
0.02%
1 jan 1974 ano
44.383
+0.009
0.02%
1 jan 1975 ano
44.392
+0.009
0.02%
1 jan 1976 ano
44.931
+0.539
1.22%
1 jan 1977 ano
44.941
+0.011
0.02%
1 jan 1978 ano
44.945
+0.004
0.01%
1 jan 1979 ano
44.945
0.0
0.0%
1 jan 1980 ano
44.945
0.0
0.0%
1 jan 1981 ano
44.945
0.0
0.0%
1 jan 1982 ano
44.945
0.0
0.0%
1 jan 1983 ano
44.945
0.0
0.0%
1 jan 1984 ano
44.945
0.0
0.0%
1 jan 1985 ano
44.813
-0.132
-0.29%
1 jan 1986 ano
46.305
+1.492
3.33%
1 jan 1987 ano
46.338
+0.033
0.07%
1 jan 1988 ano
46.447
+0.109
0.24%
1 jan 1989 ano
46.846
+0.399
0.86%
1 jan 1990 ano
47.533
+0.687
1.47%
1 jan 1991 ano
47.036
-0.497
-1.05%
1 jan 1992 ano
47.224
+0.188
0.4%
1 jan 1993 ano
47.567
+0.343
0.73%
1 jan 1994 ano
47.159
-0.408
-0.86%
1 jan 1995 ano
47.848
+0.689
1.46%
1 jan 1996 ano
47.823
-0.025
-0.05%
1 jan 1997 ano
46.475
-1.348
-2.82%
1 jan 1998 ano
46.727
+0.251
0.54%
1 jan 1999 ano
46.488
-0.239
-0.51%
1 jan 2000 ano
47.222
+0.734
1.58%
1 jan 2001 ano
46.862
-0.36
-0.76%
1 jan 2002 ano
47.157
+0.295
0.63%
1 jan 2003 ano
47.12
-0.037
-0.08%
1 jan 2004 ano
47.219
+0.098
0.21%
1 jan 2005 ano
47.426
+0.207
0.44%
1 jan 2006 ano
47.444
+0.018
0.04%
1 jan 2007 ano
47.535
+0.091
0.19%
1 jan 2008 ano
47.563
+0.028
0.06%
1 jan 2009 ano
47.589
+0.026
0.06%
1 jan 2010 ano
47.941
+0.351
0.74%
1 jan 2011 ano
48.002
+0.061
0.13%
1 jan 2012 ano
48.547
+0.545
1.13%
1 jan 2013 ano
48.723
+0.176
0.36%
1 jan 2014 ano
48.547
-0.176
-0.36%
1 jan 2015 ano
48.547
0.0
0.0%
Classificação de países por estatísticas atuais por anos


Comentários: