29
/pt/
pt
AIzaSyAYiBZKx7MnpbEhh9jyipgxe19OcubqV5w
April 1, 2024
44038
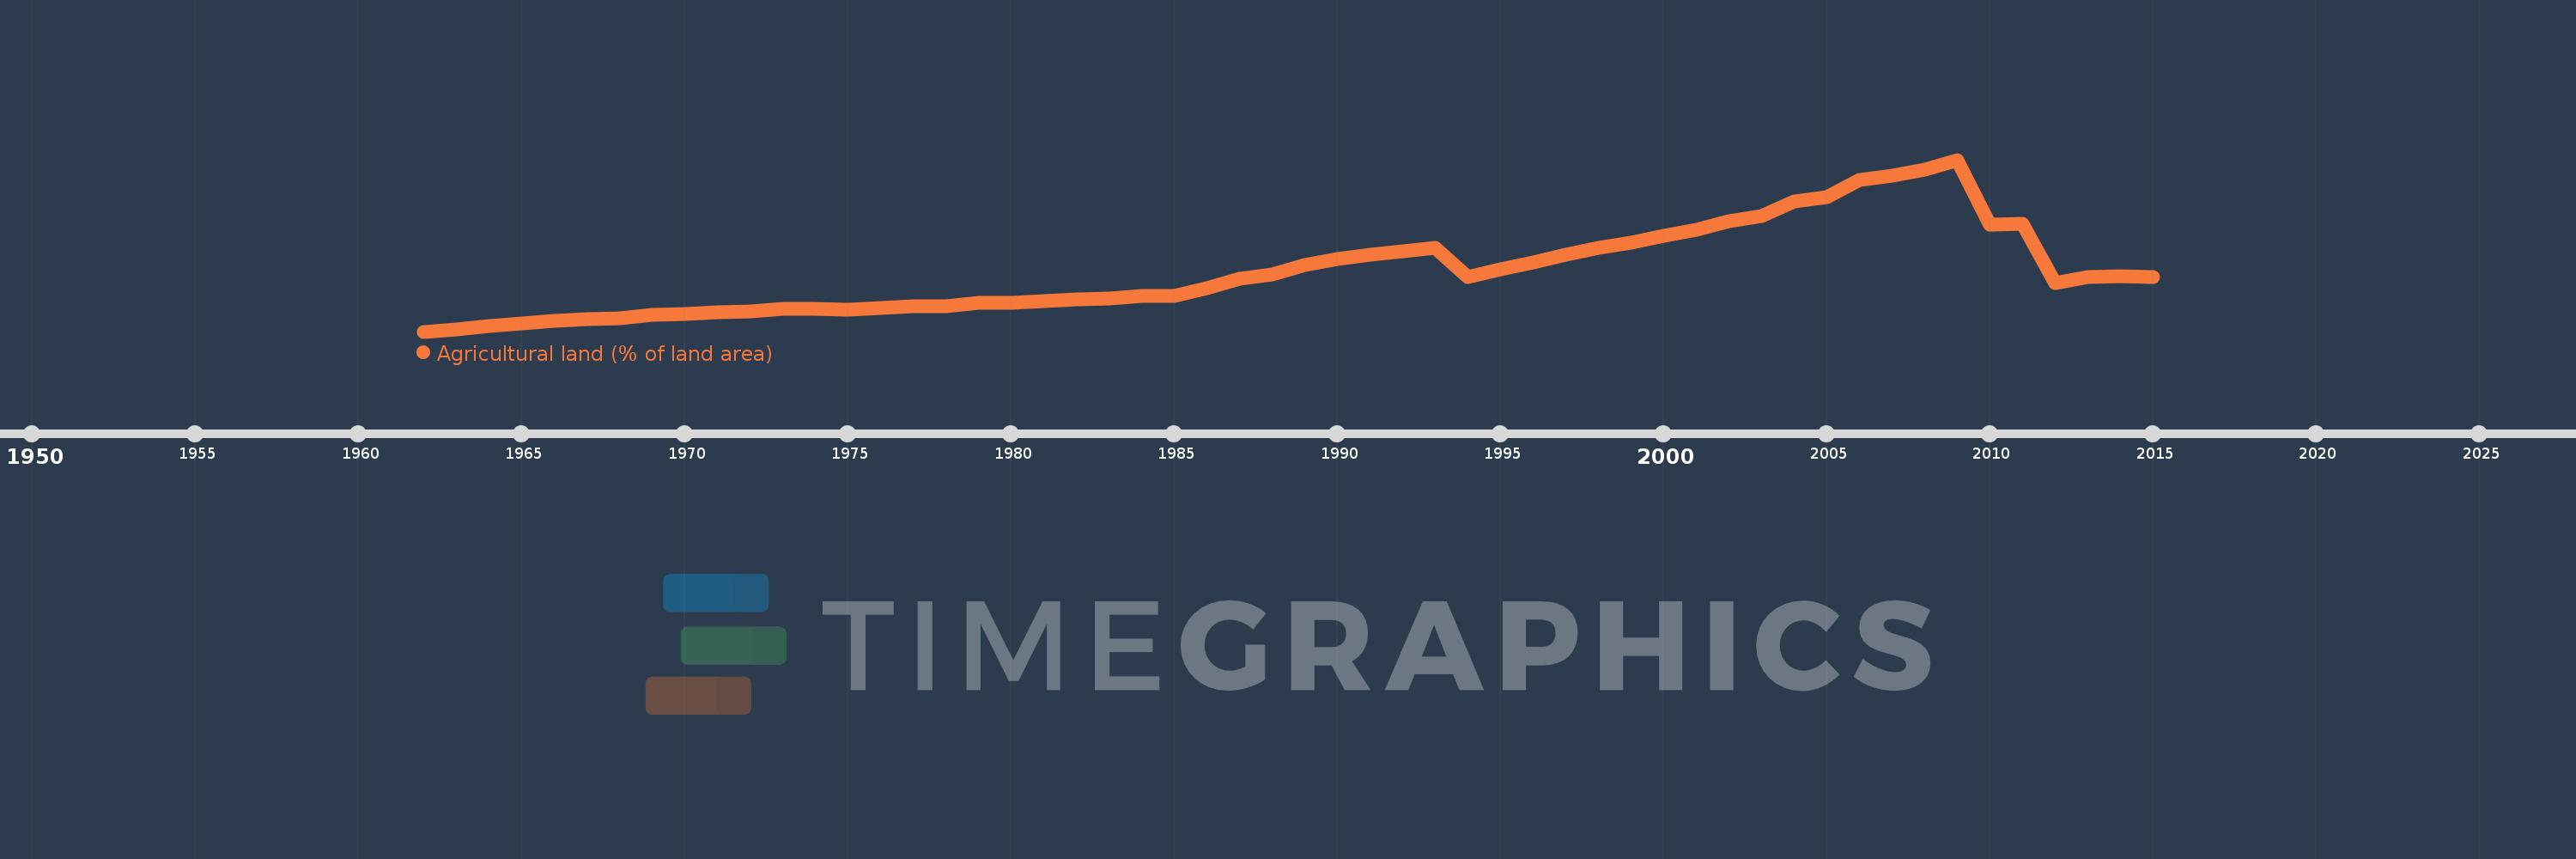
Least developed countries: UN classification
LDC
false
2
1
Agricultural land (% of land area)
2015,2014,2013,2012,2011,2010,2009,2008,2007,2006,2005,2004,2003,2002,2001,2000,1999,1998,1997,1996,1995,1994,1993,1992,1991,1990,1989,1988,1987,1986,1985,1984,1983,1982,1981,1980,1979,1978,1977,1976,1975,1974,1973,1972,1971,1970,1969,1968,1967,1966,1965,1964,1963,1962
Estas estatísticas em outros países:
AfghanistanAlbaniaAlgeriaAmerican SamoaAndorraAngolaAntigua and BarbudaArab WorldArgentinaArmeniaArubaAustraliaAustriaAzerbaijanBahamas, TheBahrainBangladeshBarbadosBelarusBelgiumBelizeBeninBermudaBhutanBoliviaBosnia and HerzegovinaBotswanaBrazilBritish Virgin IslandsBrunei DarussalamBulgariaBurkina FasoBurundiCabo VerdeCambodiaCameroonCanadaCaribbean small statesCayman IslandsCentral African RepublicCentral Europe and the BalticsChadChannel IslandsChileChinaColombiaComorosCongo, Dem. Rep.Congo, Rep.Costa RicaCote d'IvoireCroatiaCubaCyprusCzech RepublicDenmarkDjiboutiDominicaDominican RepublicEarly-demographic dividendEast Asia & PacificEast Asia & Pacific (excluding high income)East Asia & Pacific (IDA & IBRD countries)EcuadorEgypt, Arab Rep.El SalvadorEquatorial GuineaEritreaEstoniaEthiopiaEuro areaEurope & Central AsiaEurope & Central Asia (excluding high income)Europe & Central Asia (IDA & IBRD countries)European UnionFaroe IslandsFijiFinlandFragile and conflict affected situationsFranceFrench PolynesiaGabonGambia, TheGeorgiaGermanyGhanaGreeceGreenlandGrenadaGuamGuatemalaGuineaGuinea-BissauGuyanaHaitiHeavily indebted poor countries (HIPC)High incomeHondurasHong Kong SAR, ChinaHungaryIBRD onlyIcelandIDA & IBRD totalIDA blendIDA onlyIDA totalIndiaIndonesiaIran, Islamic Rep.IraqIrelandIsle of ManIsraelItalyJamaicaJapanJordanKazakhstanKenyaKiribatiKorea, Dem. People’s Rep.Korea, Rep.KosovoKuwaitKyrgyz RepublicLao PDRLate-demographic dividendLatin America & Caribbean Latin America & Caribbean (excluding high income)Latin America & the Caribbean (IDA & IBRD countries)LatviaLeast developed countries: UN classificationLebanonLesothoLiberiaLibyaLiechtensteinLithuaniaLow & middle incomeLow incomeLower middle incomeLuxembourgMacedonia, FYRMadagascarMalawiMalaysiaMaldivesMaliMaltaMarshall IslandsMauritaniaMauritiusMexicoMicronesia, Fed. Sts.Middle East & North AfricaMiddle East & North Africa (excluding high income)Middle East & North Africa (IDA & IBRD countries)Middle incomeMoldovaMongoliaMontenegroMoroccoMozambiqueMyanmarNamibiaNauruNepalNetherlandsNew CaledoniaNew ZealandNicaraguaNigerNigeriaNorth AmericaNorthern Mariana IslandsNorwayOECD membersOmanOther small statesPacific island small statesPakistanPalauPanamaPapua New GuineaParaguayPeruPhilippinesPolandPortugalPost-demographic dividendPre-demographic dividendPuerto RicoQatarRomaniaRussian FederationRwandaSamoaSan MarinoSao Tome and PrincipeSaudi ArabiaSenegalSerbiaSeychellesSierra LeoneSingaporeSlovak RepublicSloveniaSmall statesSolomon IslandsSomaliaSouth AfricaSouth AsiaSouth Asia (IDA & IBRD)SpainSri LankaSt. Kitts and NevisSt. LuciaSt. Vincent and the GrenadinesSub-Saharan Africa Sub-Saharan Africa (excluding high income)Sub-Saharan Africa (IDA & IBRD countries)SudanSurinameSwazilandSwedenSwitzerlandSyrian Arab RepublicTajikistanTanzaniaThailandTimor-LesteTogoTongaTrinidad and TobagoTunisiaTurkeyTurkmenistanTurks and Caicos IslandsTuvaluUgandaUkraineUnited Arab EmiratesUnited KingdomUnited StatesUpper middle incomeUruguayUzbekistanVanuatuVenezuela, RBVietnamVirgin Islands (U.S.)West Bank and GazaWorldYemen, Rep.ZambiaZimbabwe Linha do tempo:
Nesta escala de tempo está apresentado um gráfico de 1962 ano até 2015 ano Least developed countries: UN classification. Dados de 1961 ano ausente. O número de observações reais por data: 54.
Fonte (nome):
Indicadores de desenvolvimento mundial
Fonte (organização):
Food and Agriculture Organization, electronic files and web site.
Categorias:
Agriculture & Rural Development, Climate Change, Environment
Foi atualizado:
23 abr 2017 ano
Indicadores de alterações dos valores ao longo dos anos
Mínimo:
36.168
1 jan 1962 ano
Máximo:
40.254
1 jan 2009 ano
Na data de observação
Valor
Mudança absoluta
A alteração em relação ao valor anterior
1 jan 1962 ano
36.168
+36.168
0.0%
1 jan 1963 ano
36.221
+0.052
0.14%
1 jan 1964 ano
36.31
+0.089
0.25%
1 jan 1965 ano
36.366
+0.056
0.16%
1 jan 1966 ano
36.42
+0.054
0.15%
1 jan 1967 ano
36.455
+0.036
0.1%
1 jan 1968 ano
36.49
+0.034
0.09%
1 jan 1969 ano
36.561
+0.071
0.19%
1 jan 1970 ano
36.596
+0.035
0.1%
1 jan 1971 ano
36.618
+0.022
0.06%
1 jan 1972 ano
36.654
+0.036
0.1%
1 jan 1973 ano
36.712
+0.058
0.16%
1 jan 1974 ano
36.7
-0.012
-0.03%
1 jan 1975 ano
36.684
-0.016
-0.04%
1 jan 1976 ano
36.73
+0.045
0.12%
1 jan 1977 ano
36.775
+0.046
0.12%
1 jan 1978 ano
36.778
+0.003
0.01%
1 jan 1979 ano
36.849
+0.071
0.19%
1 jan 1980 ano
36.85
+0.0
0.0%
1 jan 1981 ano
36.892
+0.043
0.12%
1 jan 1982 ano
36.935
+0.043
0.12%
1 jan 1983 ano
36.953
+0.019
0.05%
1 jan 1984 ano
37.01
+0.056
0.15%
1 jan 1985 ano
37.016
+0.006
0.02%
1 jan 1986 ano
37.2
+0.185
0.5%
1 jan 1987 ano
37.415
+0.214
0.58%
1 jan 1988 ano
37.532
+0.117
0.31%
1 jan 1989 ano
37.761
+0.229
0.61%
1 jan 1990 ano
37.898
+0.138
0.36%
1 jan 1991 ano
38.0
+0.101
0.27%
1 jan 1992 ano
38.078
+0.079
0.21%
1 jan 1993 ano
38.151
+0.072
0.19%
1 jan 1994 ano
37.466
-0.685
-1.79%
1 jan 1995 ano
37.659
+0.193
0.51%
1 jan 1996 ano
37.822
+0.163
0.43%
1 jan 1997 ano
38.0
+0.179
0.47%
1 jan 1998 ano
38.168
+0.167
0.44%
1 jan 1999 ano
38.273
+0.105
0.28%
1 jan 2000 ano
38.456
+0.183
0.48%
1 jan 2001 ano
38.589
+0.133
0.35%
1 jan 2002 ano
38.8
+0.211
0.55%
1 jan 2003 ano
38.922
+0.122
0.31%
1 jan 2004 ano
39.253
+0.332
0.85%
1 jan 2005 ano
39.362
+0.109
0.28%
1 jan 2006 ano
39.778
+0.415
1.05%
1 jan 2007 ano
39.867
+0.089
0.22%
1 jan 2008 ano
40.026
+0.16
0.4%
1 jan 2009 ano
40.254
+0.228
0.57%
1 jan 2010 ano
38.717
-1.537
-3.82%
1 jan 2011 ano
38.736
+0.019
0.05%
1 jan 2012 ano
37.32
-1.416
-3.65%
1 jan 2013 ano
37.473
+0.153
0.41%
1 jan 2014 ano
37.476
+0.003
0.01%
1 jan 2015 ano
37.475
-0.001
0.0%
Classificação de países por estatísticas atuais por anos


Comentários: