29
/pt/
pt
AIzaSyAYiBZKx7MnpbEhh9jyipgxe19OcubqV5w
April 1, 2024
212583
Nigeria
NGA
true
2
1
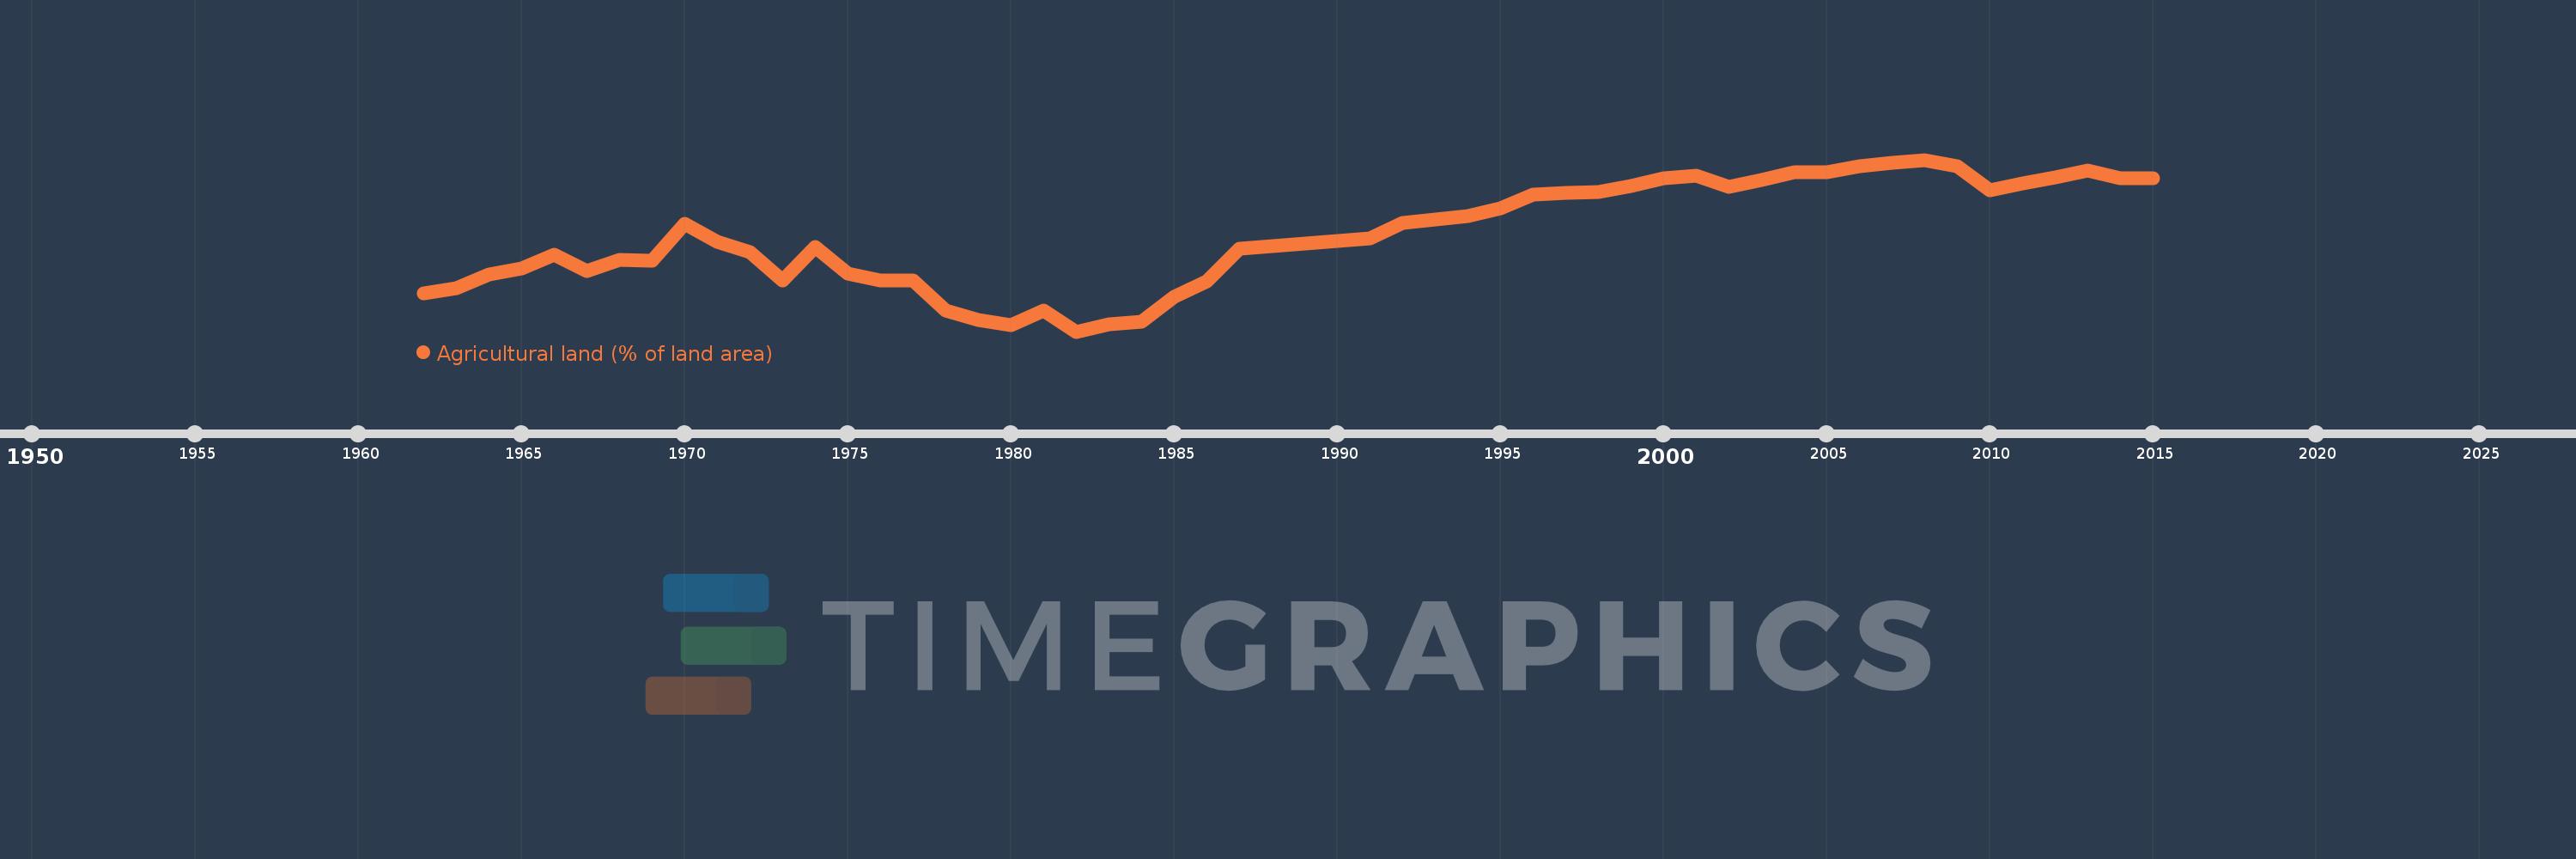
Agricultural land (% of land area)
2015,2014,2013,2012,2011,2010,2009,2008,2007,2006,2005,2004,2003,2002,2001,2000,1999,1998,1997,1996,1995,1994,1993,1992,1991,1990,1989,1988,1987,1986,1985,1984,1983,1982,1981,1980,1979,1978,1977,1976,1975,1974,1973,1972,1971,1970,1969,1968,1967,1966,1965,1964,1963,1962
Estas estatísticas em outros países:
AfghanistanAlbaniaAlgeriaAmerican SamoaAndorraAngolaAntigua and BarbudaArab WorldArgentinaArmeniaArubaAustraliaAustriaAzerbaijanBahamas, TheBahrainBangladeshBarbadosBelarusBelgiumBelizeBeninBermudaBhutanBoliviaBosnia and HerzegovinaBotswanaBrazilBritish Virgin IslandsBrunei DarussalamBulgariaBurkina FasoBurundiCabo VerdeCambodiaCameroonCanadaCaribbean small statesCayman IslandsCentral African RepublicCentral Europe and the BalticsChadChannel IslandsChileChinaColombiaComorosCongo, Dem. Rep.Congo, Rep.Costa RicaCote d'IvoireCroatiaCubaCyprusCzech RepublicDenmarkDjiboutiDominicaDominican RepublicEarly-demographic dividendEast Asia & PacificEast Asia & Pacific (excluding high income)East Asia & Pacific (IDA & IBRD countries)EcuadorEgypt, Arab Rep.El SalvadorEquatorial GuineaEritreaEstoniaEthiopiaEuro areaEurope & Central AsiaEurope & Central Asia (excluding high income)Europe & Central Asia (IDA & IBRD countries)European UnionFaroe IslandsFijiFinlandFragile and conflict affected situationsFranceFrench PolynesiaGabonGambia, TheGeorgiaGermanyGhanaGreeceGreenlandGrenadaGuamGuatemalaGuineaGuinea-BissauGuyanaHaitiHeavily indebted poor countries (HIPC)High incomeHondurasHong Kong SAR, ChinaHungaryIBRD onlyIcelandIDA & IBRD totalIDA blendIDA onlyIDA totalIndiaIndonesiaIran, Islamic Rep.IraqIrelandIsle of ManIsraelItalyJamaicaJapanJordanKazakhstanKenyaKiribatiKorea, Dem. People’s Rep.Korea, Rep.KosovoKuwaitKyrgyz RepublicLao PDRLate-demographic dividendLatin America & Caribbean Latin America & Caribbean (excluding high income)Latin America & the Caribbean (IDA & IBRD countries)LatviaLeast developed countries: UN classificationLebanonLesothoLiberiaLibyaLiechtensteinLithuaniaLow & middle incomeLow incomeLower middle incomeLuxembourgMacedonia, FYRMadagascarMalawiMalaysiaMaldivesMaliMaltaMarshall IslandsMauritaniaMauritiusMexicoMicronesia, Fed. Sts.Middle East & North AfricaMiddle East & North Africa (excluding high income)Middle East & North Africa (IDA & IBRD countries)Middle incomeMoldovaMongoliaMontenegroMoroccoMozambiqueMyanmarNamibiaNauruNepalNetherlandsNew CaledoniaNew ZealandNicaraguaNigerNigeriaNorth AmericaNorthern Mariana IslandsNorwayOECD membersOmanOther small statesPacific island small statesPakistanPalauPanamaPapua New GuineaParaguayPeruPhilippinesPolandPortugalPost-demographic dividendPre-demographic dividendPuerto RicoQatarRomaniaRussian FederationRwandaSamoaSan MarinoSao Tome and PrincipeSaudi ArabiaSenegalSerbiaSeychellesSierra LeoneSingaporeSlovak RepublicSloveniaSmall statesSolomon IslandsSomaliaSouth AfricaSouth AsiaSouth Asia (IDA & IBRD)SpainSri LankaSt. Kitts and NevisSt. LuciaSt. Vincent and the GrenadinesSub-Saharan Africa Sub-Saharan Africa (excluding high income)Sub-Saharan Africa (IDA & IBRD countries)SudanSurinameSwazilandSwedenSwitzerlandSyrian Arab RepublicTajikistanTanzaniaThailandTimor-LesteTogoTongaTrinidad and TobagoTunisiaTurkeyTurkmenistanTurks and Caicos IslandsTuvaluUgandaUkraineUnited Arab EmiratesUnited KingdomUnited StatesUpper middle incomeUruguayUzbekistanVanuatuVenezuela, RBVietnamVirgin Islands (U.S.)West Bank and GazaWorldYemen, Rep.ZambiaZimbabwe Linha do tempo:
Nesta escala de tempo está apresentado um gráfico de 1962 ano até 2015 ano Nigeria. Dados de 1961 ano ausente. O número de observações reais por data: 54.
Fonte (nome):
Indicadores de desenvolvimento mundial
Fonte (organização):
Food and Agriculture Organization, electronic files and web site.
Categorias:
Agriculture & Rural Development, Climate Change, Environment
Foi atualizado:
23 abr 2017 ano
Indicadores de alterações dos valores ao longo dos anos
Mínimo:
51.845
1 jan 1982 ano
Máximo:
80.921
1 jan 2008 ano
Na data de observação
Valor
Mudança absoluta
A alteração em relação ao valor anterior
1 jan 1962 ano
58.386
+58.386
0.0%
1 jan 1963 ano
59.181
+0.794
1.36%
1 jan 1964 ano
61.505
+2.324
3.93%
1 jan 1965 ano
62.553
+1.048
1.7%
1 jan 1966 ano
64.857
+2.305
3.68%
1 jan 1967 ano
62.042
-2.815
-4.34%
1 jan 1968 ano
63.916
+1.874
3.02%
1 jan 1969 ano
63.871
-0.045
-0.07%
1 jan 1970 ano
70.066
+6.195
9.7%
1 jan 1971 ano
67.01
-3.056
-4.36%
1 jan 1972 ano
65.305
-1.705
-2.54%
1 jan 1973 ano
60.553
-4.752
-7.28%
1 jan 1974 ano
66.208
+5.655
9.34%
1 jan 1975 ano
61.651
-4.557
-6.88%
1 jan 1976 ano
60.553
-1.098
-1.78%
1 jan 1977 ano
60.553
0.0
0.0%
1 jan 1978 ano
55.44
-5.113
-8.44%
1 jan 1979 ano
53.751
-1.689
-3.05%
1 jan 1980 ano
52.96
-0.792
-1.47%
1 jan 1981 ano
55.38
+2.42
4.57%
1 jan 1982 ano
51.845
-3.534
-6.38%
1 jan 1983 ano
53.145
+1.3
2.51%
1 jan 1984 ano
53.464
+0.318
0.6%
1 jan 1985 ano
57.76
+4.296
8.04%
1 jan 1986 ano
60.305
+2.545
4.41%
1 jan 1987 ano
65.879
+5.574
9.24%
1 jan 1988 ano
66.253
+0.373
0.57%
1 jan 1989 ano
66.744
+0.491
0.74%
1 jan 1990 ano
67.176
+0.433
0.65%
1 jan 1991 ano
67.62
+0.444
0.66%
1 jan 1992 ano
70.192
+2.573
3.8%
1 jan 1993 ano
70.761
+0.569
0.81%
1 jan 1994 ano
71.44
+0.679
0.96%
1 jan 1995 ano
72.703
+1.264
1.77%
1 jan 1996 ano
75.101
+2.398
3.3%
1 jan 1997 ano
75.321
+0.22
0.29%
1 jan 1998 ano
75.54
+0.22
0.29%
1 jan 1999 ano
76.474
+0.933
1.24%
1 jan 2000 ano
77.846
+1.372
1.79%
1 jan 2001 ano
78.285
+0.439
0.56%
1 jan 2002 ano
76.309
-1.976
-2.52%
1 jan 2003 ano
77.517
+1.208
1.58%
1 jan 2004 ano
78.779
+1.263
1.63%
1 jan 2005 ano
78.834
+0.055
0.07%
1 jan 2006 ano
79.823
+0.988
1.25%
1 jan 2007 ano
80.481
+0.659
0.83%
1 jan 2008 ano
80.921
+0.439
0.55%
1 jan 2009 ano
79.823
-1.098
-1.36%
1 jan 2010 ano
75.76
-4.062
-5.09%
1 jan 2011 ano
76.858
+1.098
1.45%
1 jan 2012 ano
77.956
+1.098
1.43%
1 jan 2013 ano
79.054
+1.098
1.41%
1 jan 2014 ano
77.736
-1.318
-1.67%
1 jan 2015 ano
77.736
0.0
0.0%
Classificação de países por estatísticas atuais por anos


Comentários: