29
/pt/
pt
AIzaSyAYiBZKx7MnpbEhh9jyipgxe19OcubqV5w
April 1, 2024
53600
Other small states
OSS
false
2
1
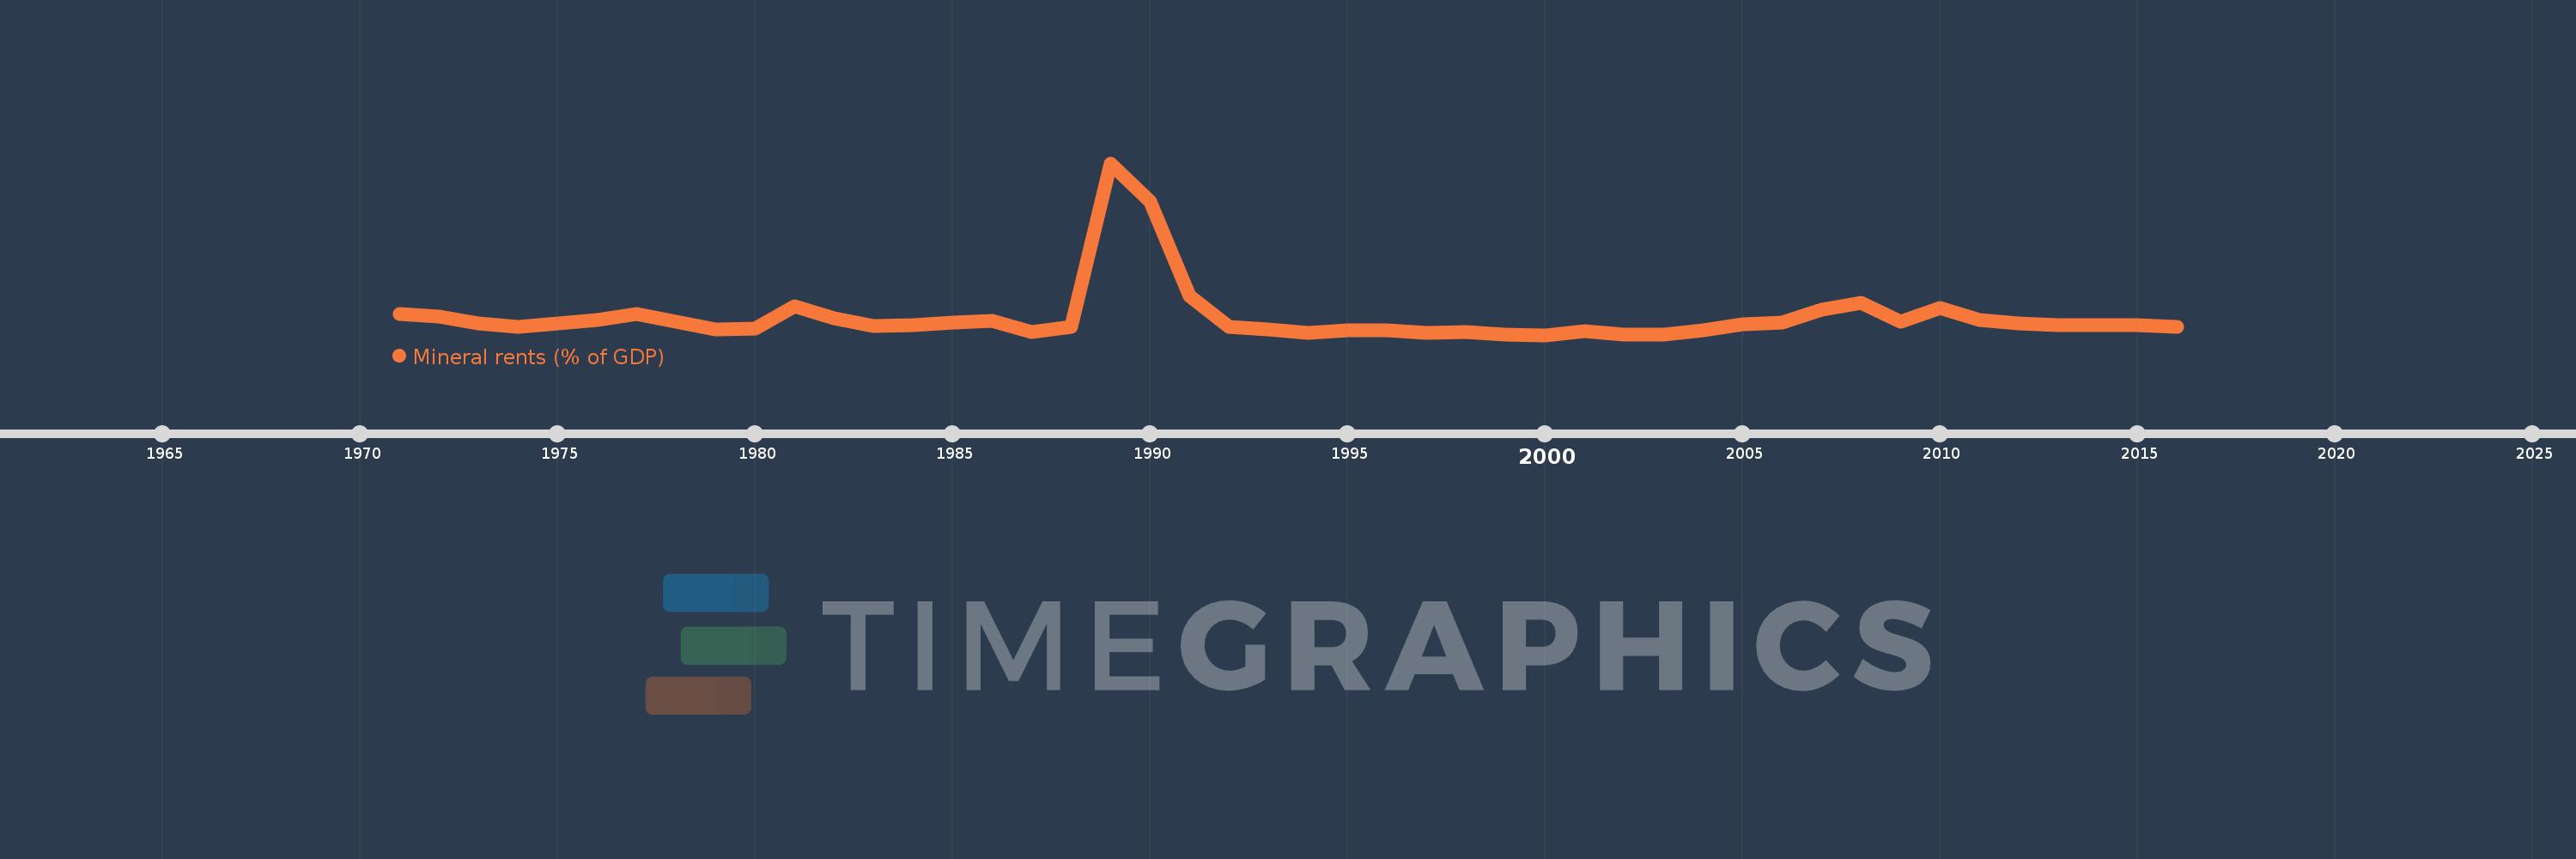
Mineral rents (% of GDP)
2016,2015,2014,2013,2012,2011,2010,2009,2008,2007,2006,2005,2004,2003,2002,2001,2000,1999,1998,1997,1996,1995,1994,1993,1992,1991,1990,1989,1988,1987,1986,1985,1984,1983,1982,1981,1980,1979,1978,1977,1976,1975,1974,1973,1972,1971
Estas estatísticas em outros países:
AfghanistanAlbaniaAlgeriaAndorraAngolaAntigua and BarbudaArab WorldArgentinaArmeniaArubaAustraliaAustriaAzerbaijanBahamas, TheBahrainBangladeshBarbadosBelarusBelgiumBelizeBeninBermudaBhutanBoliviaBosnia and HerzegovinaBotswanaBrazilBrunei DarussalamBulgariaBurkina FasoBurundiCabo VerdeCambodiaCameroonCanadaCaribbean small statesCayman IslandsCentral African RepublicCentral Europe and the BalticsChadChannel IslandsChileChinaColombiaComorosCongo, Dem. Rep.Congo, Rep.Costa RicaCote d'IvoireCroatiaCubaCyprusCzech RepublicDenmarkDjiboutiDominicaDominican RepublicEarly-demographic dividendEast Asia & PacificEast Asia & Pacific (excluding high income)East Asia & Pacific (IDA & IBRD countries)EcuadorEgypt, Arab Rep.El SalvadorEquatorial GuineaEritreaEstoniaEthiopiaEuro areaEurope & Central AsiaEurope & Central Asia (excluding high income)Europe & Central Asia (IDA & IBRD countries)European UnionFaroe IslandsFijiFinlandFragile and conflict affected situationsFranceFrench PolynesiaGabonGambia, TheGeorgiaGermanyGhanaGreeceGreenlandGrenadaGuatemalaGuineaGuinea-BissauGuyanaHaitiHeavily indebted poor countries (HIPC)High incomeHondurasHong Kong SAR, ChinaHungaryIBRD onlyIcelandIDA & IBRD totalIDA blendIDA onlyIDA totalIndiaIndonesiaIran, Islamic Rep.IraqIrelandIsle of ManIsraelItalyJamaicaJapanJordanKazakhstanKenyaKiribatiKorea, Rep.KosovoKuwaitKyrgyz RepublicLao PDRLate-demographic dividendLatin America & Caribbean Latin America & Caribbean (excluding high income)Latin America & the Caribbean (IDA & IBRD countries)LatviaLeast developed countries: UN classificationLebanonLesothoLiberiaLibyaLiechtensteinLithuaniaLow & middle incomeLow incomeLower middle incomeLuxembourgMacao SAR, ChinaMacedonia, FYRMadagascarMalawiMalaysiaMaldivesMaliMaltaMarshall IslandsMauritaniaMauritiusMexicoMicronesia, Fed. Sts.Middle East & North AfricaMiddle East & North Africa (excluding high income)Middle East & North Africa (IDA & IBRD countries)Middle incomeMoldovaMonacoMongoliaMontenegroMoroccoMozambiqueMyanmarNamibiaNepalNetherlandsNew CaledoniaNew ZealandNicaraguaNigerNigeriaNorth AmericaNorwayOECD membersOmanOther small statesPacific island small statesPakistanPalauPanamaPapua New GuineaParaguayPeruPhilippinesPolandPortugalPost-demographic dividendPre-demographic dividendPuerto RicoQatarRomaniaRussian FederationRwandaSamoaSan MarinoSao Tome and PrincipeSaudi ArabiaSenegalSerbiaSeychellesSierra LeoneSingaporeSlovak RepublicSloveniaSmall statesSolomon IslandsSomaliaSouth AfricaSouth AsiaSouth Asia (IDA & IBRD)South SudanSpainSri LankaSt. Kitts and NevisSt. LuciaSt. Vincent and the GrenadinesSub-Saharan Africa Sub-Saharan Africa (excluding high income)Sub-Saharan Africa (IDA & IBRD countries)SudanSurinameSwazilandSwedenSwitzerlandSyrian Arab RepublicTajikistanTanzaniaThailandTimor-LesteTogoTongaTrinidad and TobagoTunisiaTurkeyTurkmenistanTuvaluUgandaUkraineUnited Arab EmiratesUnited KingdomUnited StatesUpper middle incomeUruguayUzbekistanVanuatuVenezuela, RBVietnamVirgin Islands (U.S.)West Bank and GazaWorldYemen, Rep.ZambiaZimbabwe Linha do tempo:
Nesta escala de tempo está apresentado um gráfico de 1971 ano até 2016 ano Other small states. Dados de 1970 ano ausente. O número de observações reais por data: 46.
Fonte (nome):
Indicadores de desenvolvimento mundial
Fonte (organização):
Estimates based on sources and methods described in "The Changing Wealth of Nations: Measuring Sustainable Development in the New Millennium" (World Bank, 2011).
Categorias:
Energy & Mining, Environment
Foi atualizado:
23 abr 2017 ano
Indicadores de alterações dos valores ao longo dos anos
Mínimo:
0.005
1 jan 2000 ano
Máximo:
2.951
1 jan 1989 ano
Na data de observação
Valor
Mudança absoluta
A alteração em relação ao valor anterior
1 jan 1971 ano
0.363
+0.363
0.0%
1 jan 1972 ano
0.316
-0.047
-13.07%
1 jan 1973 ano
0.204
-0.112
-35.34%
1 jan 1974 ano
0.147
-0.057
-28.06%
1 jan 1975 ano
0.2
+0.054
36.49%
1 jan 1976 ano
0.266
+0.066
32.93%
1 jan 1977 ano
0.363
+0.097
36.28%
1 jan 1978 ano
0.228
-0.135
-37.29%
1 jan 1979 ano
0.094
-0.133
-58.52%
1 jan 1980 ano
0.122
+0.028
29.54%
1 jan 1981 ano
0.5
+0.377
308.25%
1 jan 1982 ano
0.288
-0.212
-42.37%
1 jan 1983 ano
0.165
-0.123
-42.75%
1 jan 1984 ano
0.179
+0.014
8.69%
1 jan 1985 ano
0.217
+0.038
21.2%
1 jan 1986 ano
0.251
+0.034
15.54%
1 jan 1987 ano
0.057
-0.194
-77.43%
1 jan 1988 ano
0.141
+0.084
148.63%
1 jan 1989 ano
2.951
+2.81
2.0 mil%
1 jan 1990 ano
2.302
-0.649
-22.0%
1 jan 1991 ano
0.672
-1.63
-70.81%
1 jan 1992 ano
0.14
-0.532
-79.22%
1 jan 1993 ano
0.097
-0.043
-30.87%
1 jan 1994 ano
0.042
-0.055
-56.57%
1 jan 1995 ano
0.085
+0.043
102.33%
1 jan 1996 ano
0.088
+0.004
4.15%
1 jan 1997 ano
0.047
-0.042
-47.25%
1 jan 1998 ano
0.057
+0.011
23.34%
1 jan 1999 ano
0.008
-0.05
-86.57%
1 jan 2000 ano
0.005
-0.003
-37.69%
1 jan 2001 ano
0.075
+0.07
1.46 mil%
1 jan 2002 ano
0.008
-0.067
-89.9%
1 jan 2003 ano
0.012
+0.005
61.91%
1 jan 2004 ano
0.086
+0.074
606.11%
1 jan 2005 ano
0.186
+0.099
114.87%
1 jan 2006 ano
0.217
+0.032
17.0%
1 jan 2007 ano
0.445
+0.227
104.48%
1 jan 2008 ano
0.551
+0.106
23.9%
1 jan 2009 ano
0.234
-0.317
-57.49%
1 jan 2010 ano
0.462
+0.228
97.21%
1 jan 2011 ano
0.262
-0.2
-43.27%
1 jan 2012 ano
0.197
-0.065
-24.65%
1 jan 2013 ano
0.18
-0.017
-8.75%
1 jan 2014 ano
0.169
-0.011
-6.2%
1 jan 2015 ano
0.173
+0.004
2.45%
1 jan 2016 ano
0.142
-0.031
-17.81%
Classificação de países por estatísticas atuais por anos


Comentários: