29
/pt/
pt
AIzaSyAYiBZKx7MnpbEhh9jyipgxe19OcubqV5w
April 1, 2024
36787
IBRD only
IBD
false
2
1
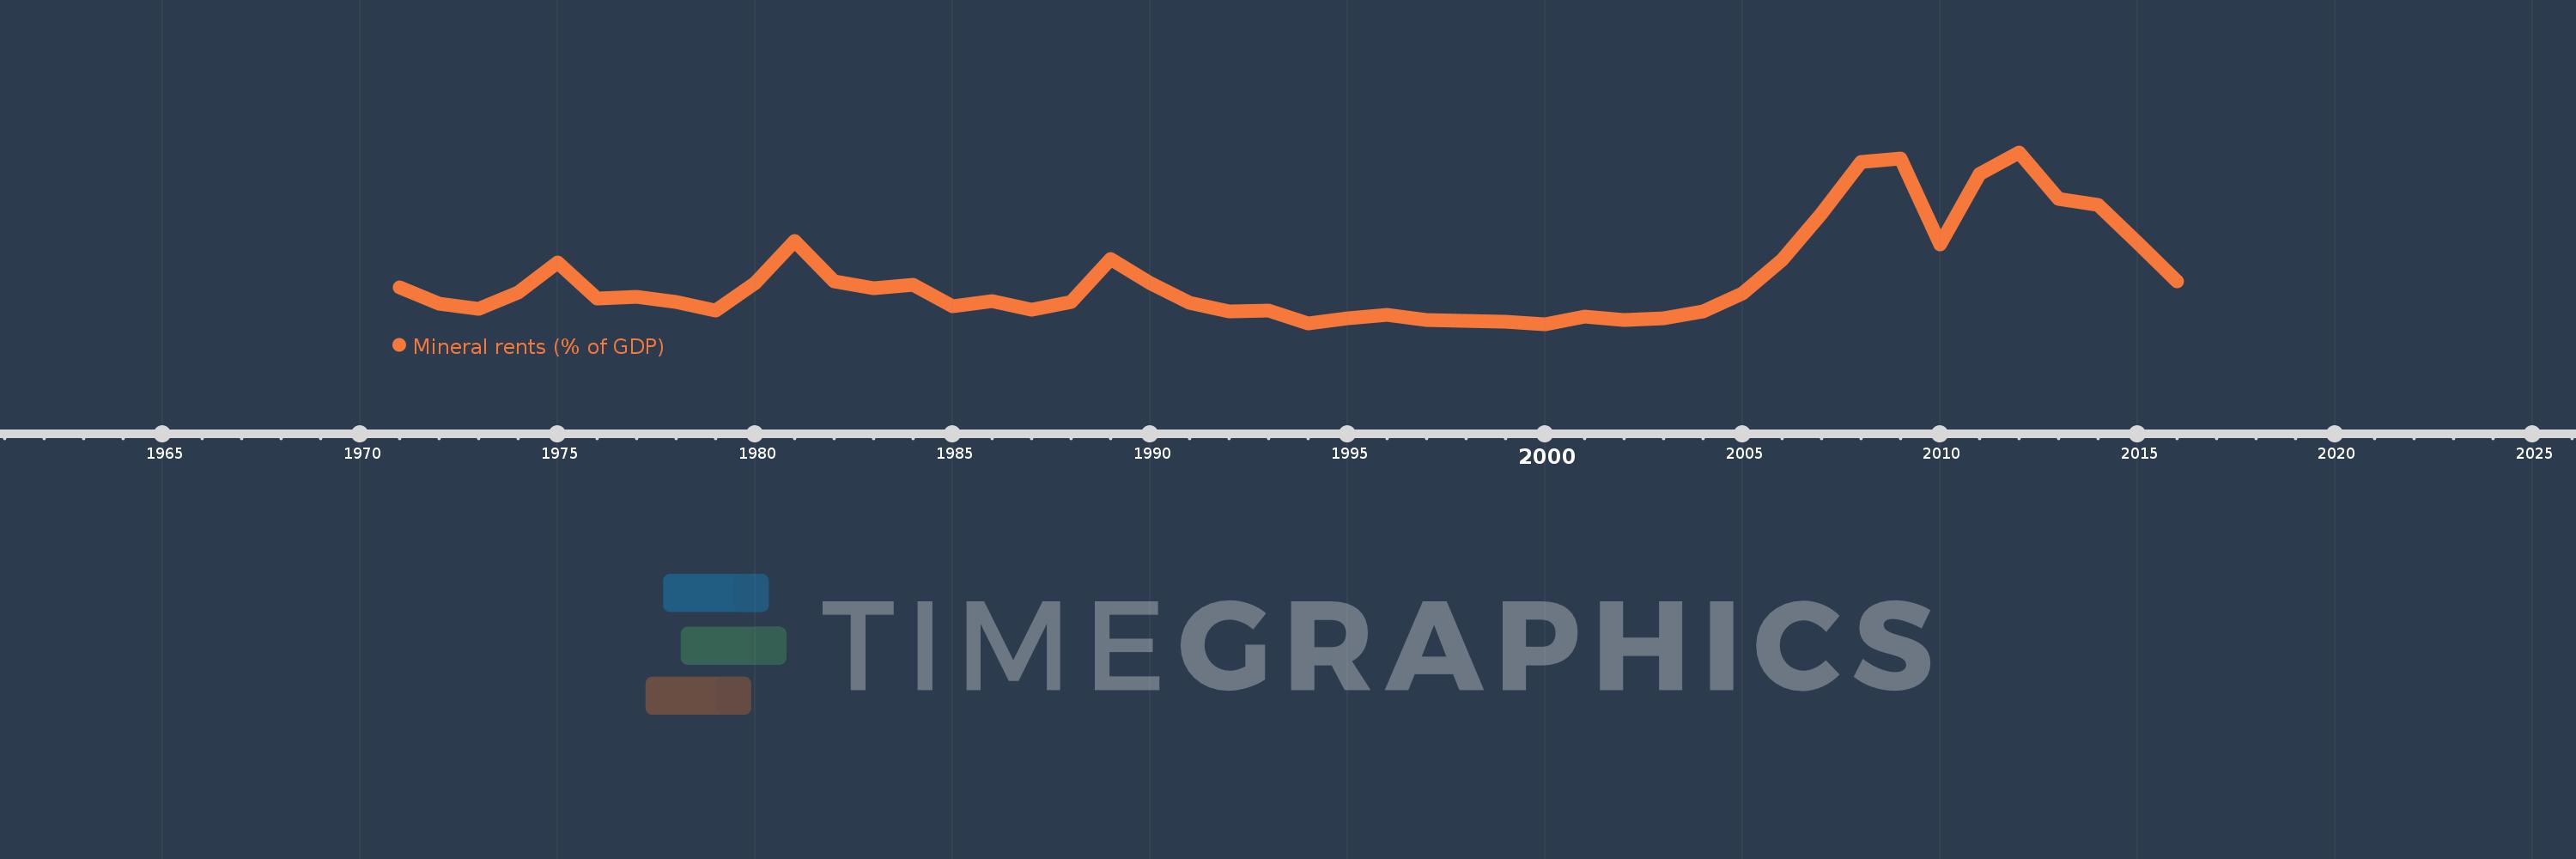
Mineral rents (% of GDP)
2016,2015,2014,2013,2012,2011,2010,2009,2008,2007,2006,2005,2004,2003,2002,2001,2000,1999,1998,1997,1996,1995,1994,1993,1992,1991,1990,1989,1988,1987,1986,1985,1984,1983,1982,1981,1980,1979,1978,1977,1976,1975,1974,1973,1972,1971
Estas estatísticas em outros países:
AfghanistanAlbaniaAlgeriaAndorraAngolaAntigua and BarbudaArab WorldArgentinaArmeniaArubaAustraliaAustriaAzerbaijanBahamas, TheBahrainBangladeshBarbadosBelarusBelgiumBelizeBeninBermudaBhutanBoliviaBosnia and HerzegovinaBotswanaBrazilBrunei DarussalamBulgariaBurkina FasoBurundiCabo VerdeCambodiaCameroonCanadaCaribbean small statesCayman IslandsCentral African RepublicCentral Europe and the BalticsChadChannel IslandsChileChinaColombiaComorosCongo, Dem. Rep.Congo, Rep.Costa RicaCote d'IvoireCroatiaCubaCyprusCzech RepublicDenmarkDjiboutiDominicaDominican RepublicEarly-demographic dividendEast Asia & PacificEast Asia & Pacific (excluding high income)East Asia & Pacific (IDA & IBRD countries)EcuadorEgypt, Arab Rep.El SalvadorEquatorial GuineaEritreaEstoniaEthiopiaEuro areaEurope & Central AsiaEurope & Central Asia (excluding high income)Europe & Central Asia (IDA & IBRD countries)European UnionFaroe IslandsFijiFinlandFragile and conflict affected situationsFranceFrench PolynesiaGabonGambia, TheGeorgiaGermanyGhanaGreeceGreenlandGrenadaGuatemalaGuineaGuinea-BissauGuyanaHaitiHeavily indebted poor countries (HIPC)High incomeHondurasHong Kong SAR, ChinaHungaryIBRD onlyIcelandIDA & IBRD totalIDA blendIDA onlyIDA totalIndiaIndonesiaIran, Islamic Rep.IraqIrelandIsle of ManIsraelItalyJamaicaJapanJordanKazakhstanKenyaKiribatiKorea, Rep.KosovoKuwaitKyrgyz RepublicLao PDRLate-demographic dividendLatin America & Caribbean Latin America & Caribbean (excluding high income)Latin America & the Caribbean (IDA & IBRD countries)LatviaLeast developed countries: UN classificationLebanonLesothoLiberiaLibyaLiechtensteinLithuaniaLow & middle incomeLow incomeLower middle incomeLuxembourgMacao SAR, ChinaMacedonia, FYRMadagascarMalawiMalaysiaMaldivesMaliMaltaMarshall IslandsMauritaniaMauritiusMexicoMicronesia, Fed. Sts.Middle East & North AfricaMiddle East & North Africa (excluding high income)Middle East & North Africa (IDA & IBRD countries)Middle incomeMoldovaMonacoMongoliaMontenegroMoroccoMozambiqueMyanmarNamibiaNepalNetherlandsNew CaledoniaNew ZealandNicaraguaNigerNigeriaNorth AmericaNorwayOECD membersOmanOther small statesPacific island small statesPakistanPalauPanamaPapua New GuineaParaguayPeruPhilippinesPolandPortugalPost-demographic dividendPre-demographic dividendPuerto RicoQatarRomaniaRussian FederationRwandaSamoaSan MarinoSao Tome and PrincipeSaudi ArabiaSenegalSerbiaSeychellesSierra LeoneSingaporeSlovak RepublicSloveniaSmall statesSolomon IslandsSomaliaSouth AfricaSouth AsiaSouth Asia (IDA & IBRD)South SudanSpainSri LankaSt. Kitts and NevisSt. LuciaSt. Vincent and the GrenadinesSub-Saharan Africa Sub-Saharan Africa (excluding high income)Sub-Saharan Africa (IDA & IBRD countries)SudanSurinameSwazilandSwedenSwitzerlandSyrian Arab RepublicTajikistanTanzaniaThailandTimor-LesteTogoTongaTrinidad and TobagoTunisiaTurkeyTurkmenistanTuvaluUgandaUkraineUnited Arab EmiratesUnited KingdomUnited StatesUpper middle incomeUruguayUzbekistanVanuatuVenezuela, RBVietnamVirgin Islands (U.S.)West Bank and GazaWorldYemen, Rep.ZambiaZimbabwe Linha do tempo:
Nesta escala de tempo está apresentado um gráfico de 1971 ano até 2016 ano IBRD only. Dados de 1970 ano ausente. O número de observações reais por data: 46.
Fonte (nome):
Indicadores de desenvolvimento mundial
Fonte (organização):
Estimates based on sources and methods described in "The Changing Wealth of Nations: Measuring Sustainable Development in the New Millennium" (World Bank, 2011).
Categorias:
Energy & Mining, Environment
Foi atualizado:
23 abr 2017 ano
Indicadores de alterações dos valores ao longo dos anos
Mínimo:
0.254
1 jan 2000 ano
Máximo:
2.229
1 jan 2012 ano
Na data de observação
Valor
Mudança absoluta
A alteração em relação ao valor anterior
1 jan 1971 ano
0.681
+0.681
0.0%
1 jan 1972 ano
0.489
-0.192
-28.19%
1 jan 1973 ano
0.427
-0.063
-12.79%
1 jan 1974 ano
0.623
+0.196
45.92%
1 jan 1975 ano
0.968
+0.345
55.4%
1 jan 1976 ano
0.553
-0.415
-42.86%
1 jan 1977 ano
0.569
+0.016
2.98%
1 jan 1978 ano
0.511
-0.058
-10.27%
1 jan 1979 ano
0.411
-0.1
-19.59%
1 jan 1980 ano
0.725
+0.314
76.46%
1 jan 1981 ano
1.206
+0.481
66.33%
1 jan 1982 ano
0.751
-0.455
-37.72%
1 jan 1983 ano
0.664
-0.086
-11.51%
1 jan 1984 ano
0.706
+0.041
6.21%
1 jan 1985 ano
0.463
-0.243
-34.41%
1 jan 1986 ano
0.523
+0.06
13.01%
1 jan 1987 ano
0.419
-0.104
-19.94%
1 jan 1988 ano
0.514
+0.096
22.83%
1 jan 1989 ano
1.007
+0.493
95.82%
1 jan 1990 ano
0.724
-0.283
-28.12%
1 jan 1991 ano
0.501
-0.223
-30.8%
1 jan 1992 ano
0.402
-0.099
-19.79%
1 jan 1993 ano
0.409
+0.007
1.71%
1 jan 1994 ano
0.263
-0.146
-35.77%
1 jan 1995 ano
0.322
+0.059
22.52%
1 jan 1996 ano
0.364
+0.042
13.01%
1 jan 1997 ano
0.299
-0.064
-17.67%
1 jan 1998 ano
0.291
-0.009
-2.93%
1 jan 1999 ano
0.282
-0.008
-2.92%
1 jan 2000 ano
0.254
-0.028
-10.04%
1 jan 2001 ano
0.345
+0.091
36.03%
1 jan 2002 ano
0.301
-0.044
-12.68%
1 jan 2003 ano
0.324
+0.023
7.64%
1 jan 2004 ano
0.399
+0.075
22.98%
1 jan 2005 ano
0.611
+0.212
53.05%
1 jan 2006 ano
0.994
+0.384
62.84%
1 jan 2007 ano
1.531
+0.537
53.99%
1 jan 2008 ano
2.116
+0.585
38.18%
1 jan 2009 ano
2.162
+0.046
2.19%
1 jan 2010 ano
1.171
-0.991
-45.85%
1 jan 2011 ano
1.981
+0.81
69.15%
1 jan 2012 ano
2.229
+0.249
12.56%
1 jan 2013 ano
1.698
-0.531
-23.84%
1 jan 2014 ano
1.624
-0.074
-4.34%
1 jan 2015 ano
1.192
-0.433
-26.63%
1 jan 2016 ano
0.743
-0.449
-37.68%
Classificação de países por estatísticas atuais por anos


Comentários: