29
/pt/
pt
AIzaSyAYiBZKx7MnpbEhh9jyipgxe19OcubqV5w
April 1, 2024
24310
Arab World
ARB
false
2
1
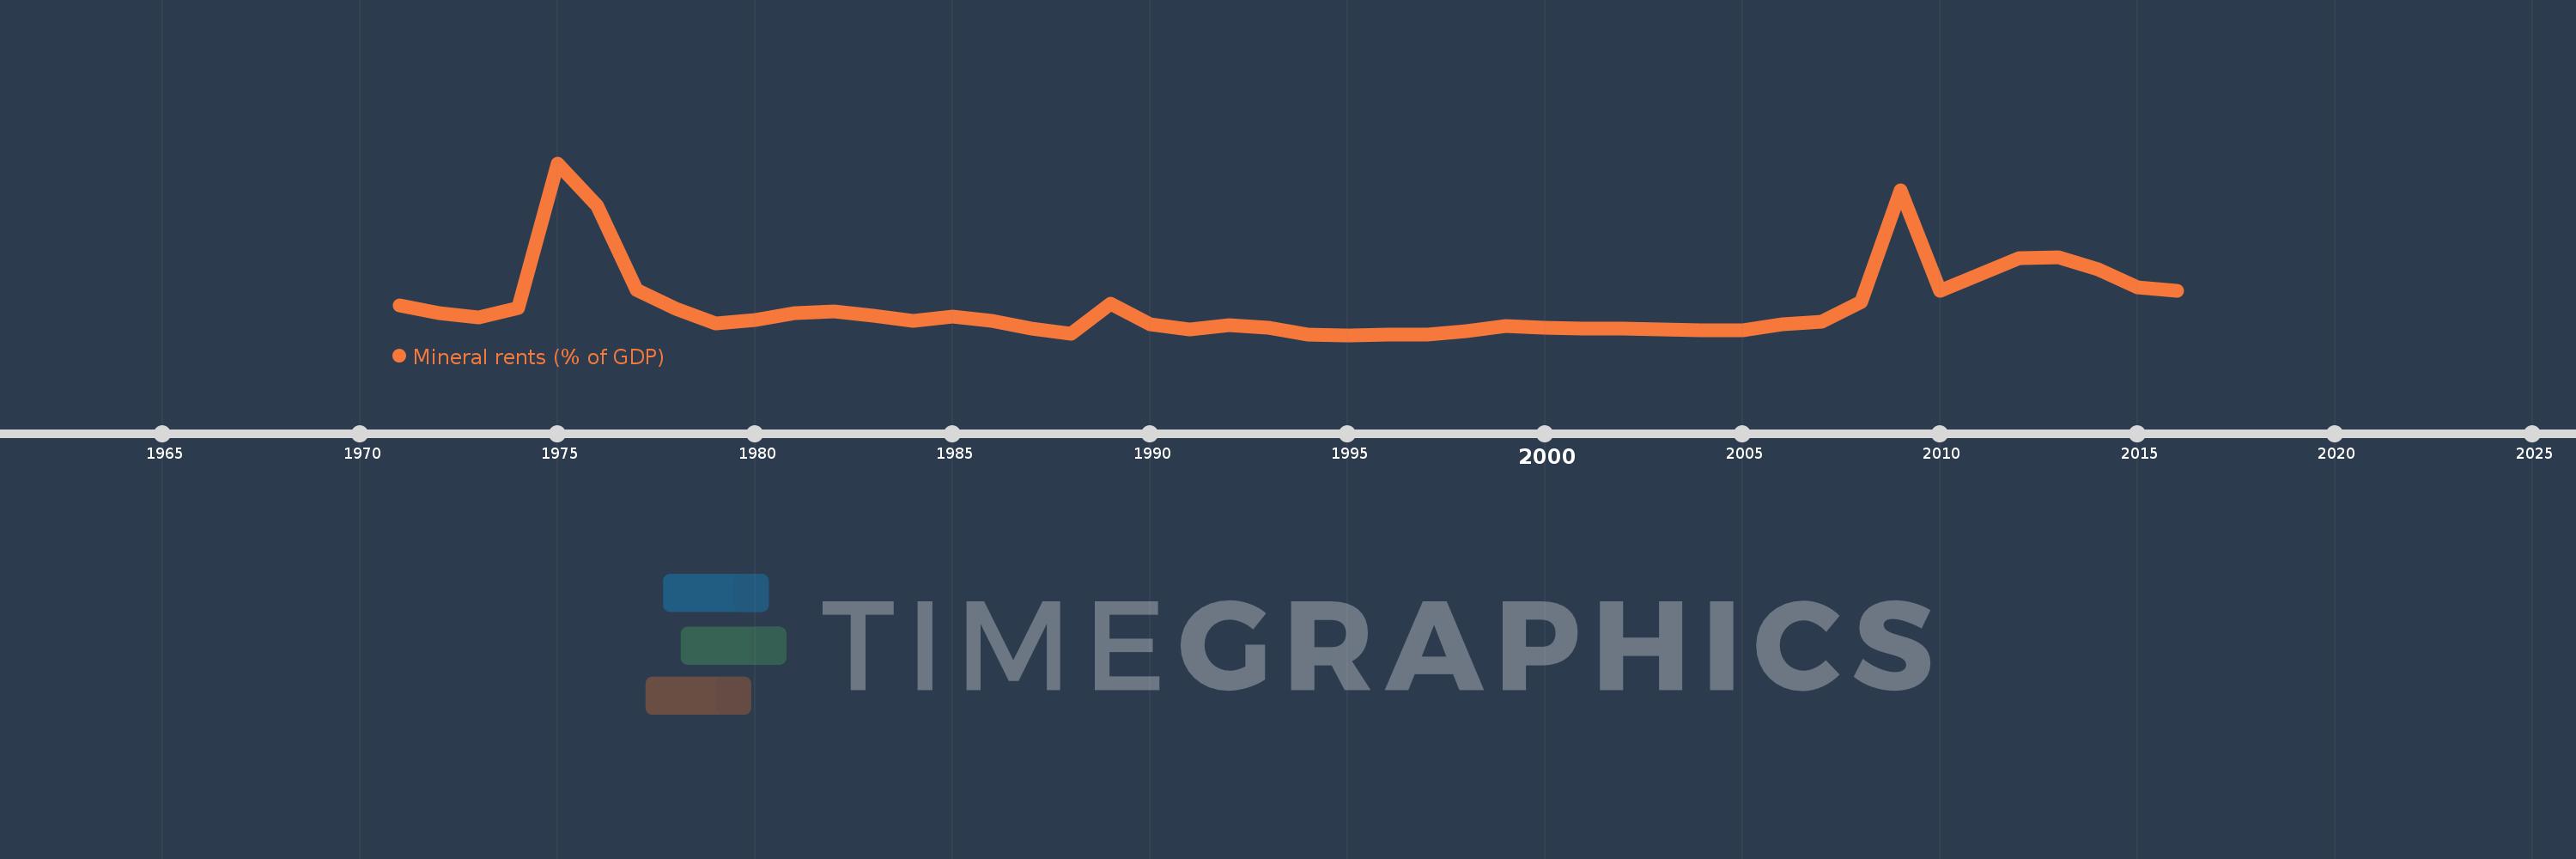
Mineral rents (% of GDP)
2016,2015,2014,2013,2012,2011,2010,2009,2008,2007,2006,2005,2004,2003,2002,2001,2000,1999,1998,1997,1996,1995,1994,1993,1992,1991,1990,1989,1988,1987,1986,1985,1984,1983,1982,1981,1980,1979,1978,1977,1976,1975,1974,1973,1972,1971
Estas estatísticas em outros países:
AfghanistanAlbaniaAlgeriaAndorraAngolaAntigua and BarbudaArab WorldArgentinaArmeniaArubaAustraliaAustriaAzerbaijanBahamas, TheBahrainBangladeshBarbadosBelarusBelgiumBelizeBeninBermudaBhutanBoliviaBosnia and HerzegovinaBotswanaBrazilBrunei DarussalamBulgariaBurkina FasoBurundiCabo VerdeCambodiaCameroonCanadaCaribbean small statesCayman IslandsCentral African RepublicCentral Europe and the BalticsChadChannel IslandsChileChinaColombiaComorosCongo, Dem. Rep.Congo, Rep.Costa RicaCote d'IvoireCroatiaCubaCyprusCzech RepublicDenmarkDjiboutiDominicaDominican RepublicEarly-demographic dividendEast Asia & PacificEast Asia & Pacific (excluding high income)East Asia & Pacific (IDA & IBRD countries)EcuadorEgypt, Arab Rep.El SalvadorEquatorial GuineaEritreaEstoniaEthiopiaEuro areaEurope & Central AsiaEurope & Central Asia (excluding high income)Europe & Central Asia (IDA & IBRD countries)European UnionFaroe IslandsFijiFinlandFragile and conflict affected situationsFranceFrench PolynesiaGabonGambia, TheGeorgiaGermanyGhanaGreeceGreenlandGrenadaGuatemalaGuineaGuinea-BissauGuyanaHaitiHeavily indebted poor countries (HIPC)High incomeHondurasHong Kong SAR, ChinaHungaryIBRD onlyIcelandIDA & IBRD totalIDA blendIDA onlyIDA totalIndiaIndonesiaIran, Islamic Rep.IraqIrelandIsle of ManIsraelItalyJamaicaJapanJordanKazakhstanKenyaKiribatiKorea, Rep.KosovoKuwaitKyrgyz RepublicLao PDRLate-demographic dividendLatin America & Caribbean Latin America & Caribbean (excluding high income)Latin America & the Caribbean (IDA & IBRD countries)LatviaLeast developed countries: UN classificationLebanonLesothoLiberiaLibyaLiechtensteinLithuaniaLow & middle incomeLow incomeLower middle incomeLuxembourgMacao SAR, ChinaMacedonia, FYRMadagascarMalawiMalaysiaMaldivesMaliMaltaMarshall IslandsMauritaniaMauritiusMexicoMicronesia, Fed. Sts.Middle East & North AfricaMiddle East & North Africa (excluding high income)Middle East & North Africa (IDA & IBRD countries)Middle incomeMoldovaMonacoMongoliaMontenegroMoroccoMozambiqueMyanmarNamibiaNepalNetherlandsNew CaledoniaNew ZealandNicaraguaNigerNigeriaNorth AmericaNorwayOECD membersOmanOther small statesPacific island small statesPakistanPalauPanamaPapua New GuineaParaguayPeruPhilippinesPolandPortugalPost-demographic dividendPre-demographic dividendPuerto RicoQatarRomaniaRussian FederationRwandaSamoaSan MarinoSao Tome and PrincipeSaudi ArabiaSenegalSerbiaSeychellesSierra LeoneSingaporeSlovak RepublicSloveniaSmall statesSolomon IslandsSomaliaSouth AfricaSouth AsiaSouth Asia (IDA & IBRD)South SudanSpainSri LankaSt. Kitts and NevisSt. LuciaSt. Vincent and the GrenadinesSub-Saharan Africa Sub-Saharan Africa (excluding high income)Sub-Saharan Africa (IDA & IBRD countries)SudanSurinameSwazilandSwedenSwitzerlandSyrian Arab RepublicTajikistanTanzaniaThailandTimor-LesteTogoTongaTrinidad and TobagoTunisiaTurkeyTurkmenistanTuvaluUgandaUkraineUnited Arab EmiratesUnited KingdomUnited StatesUpper middle incomeUruguayUzbekistanVanuatuVenezuela, RBVietnamVirgin Islands (U.S.)West Bank and GazaWorldYemen, Rep.ZambiaZimbabwe Linha do tempo:
Nesta escala de tempo está apresentado um gráfico de 1971 ano até 2016 ano Arab World. Dados de 1970 ano ausente. O número de observações reais por data: 46.
Fonte (nome):
Indicadores de desenvolvimento mundial
Fonte (organização):
Estimates based on sources and methods described in "The Changing Wealth of Nations: Measuring Sustainable Development in the New Millennium" (World Bank, 2011).
Categorias:
Energy & Mining, Environment
Foi atualizado:
23 abr 2017 ano
Indicadores de alterações dos valores ao longo dos anos
Mínimo:
0.021
1 jan 1995 ano
Máximo:
0.931
1 jan 1975 ano
Na data de observação
Valor
Mudança absoluta
A alteração em relação ao valor anterior
1 jan 1971 ano
0.177
+0.177
0.0%
1 jan 1972 ano
0.138
-0.039
-22.02%
1 jan 1973 ano
0.115
-0.024
-17.03%
1 jan 1974 ano
0.164
+0.049
43.12%
1 jan 1975 ano
0.931
+0.767
467.19%
1 jan 1976 ano
0.708
-0.223
-23.94%
1 jan 1977 ano
0.259
-0.45
-63.49%
1 jan 1978 ano
0.16
-0.098
-38.02%
1 jan 1979 ano
0.084
-0.077
-47.78%
1 jan 1980 ano
0.1
+0.017
19.77%
1 jan 1981 ano
0.138
+0.038
38.09%
1 jan 1982 ano
0.148
+0.01
6.87%
1 jan 1983 ano
0.124
-0.024
-16.16%
1 jan 1984 ano
0.095
-0.029
-23.36%
1 jan 1985 ano
0.12
+0.025
26.55%
1 jan 1986 ano
0.097
-0.023
-19.36%
1 jan 1987 ano
0.057
-0.04
-41.2%
1 jan 1988 ano
0.028
-0.029
-50.23%
1 jan 1989 ano
0.186
+0.157
553.82%
1 jan 1990 ano
0.079
-0.106
-57.3%
1 jan 1991 ano
0.052
-0.027
-34.63%
1 jan 1992 ano
0.075
+0.023
44.01%
1 jan 1993 ano
0.058
-0.016
-21.92%
1 jan 1994 ano
0.023
-0.035
-60.44%
1 jan 1995 ano
0.021
-0.002
-9.5%
1 jan 1996 ano
0.023
+0.003
12.65%
1 jan 1997 ano
0.024
+0.001
2.69%
1 jan 1998 ano
0.042
+0.018
73.95%
1 jan 1999 ano
0.071
+0.029
68.72%
1 jan 2000 ano
0.059
-0.012
-17.01%
1 jan 2001 ano
0.057
-0.002
-3.37%
1 jan 2002 ano
0.056
-0.001
-0.89%
1 jan 2003 ano
0.052
-0.004
-6.9%
1 jan 2004 ano
0.044
-0.009
-16.86%
1 jan 2005 ano
0.048
+0.004
9.37%
1 jan 2006 ano
0.076
+0.028
58.51%
1 jan 2007 ano
0.09
+0.014
18.75%
1 jan 2008 ano
0.194
+0.105
116.85%
1 jan 2009 ano
0.788
+0.594
305.33%
1 jan 2010 ano
0.255
-0.533
-67.68%
1 jan 2011 ano
0.342
+0.087
34.11%
1 jan 2012 ano
0.43
+0.088
25.84%
1 jan 2013 ano
0.431
+0.001
0.29%
1 jan 2014 ano
0.367
-0.065
-14.97%
1 jan 2015 ano
0.273
-0.094
-25.63%
1 jan 2016 ano
0.257
-0.015
-5.59%
Classificação de países por estatísticas atuais por anos


Comentários: