29
/pt/
pt
AIzaSyAYiBZKx7MnpbEhh9jyipgxe19OcubqV5w
April 1, 2024
286191
Zambia
ZMB
true
2
1
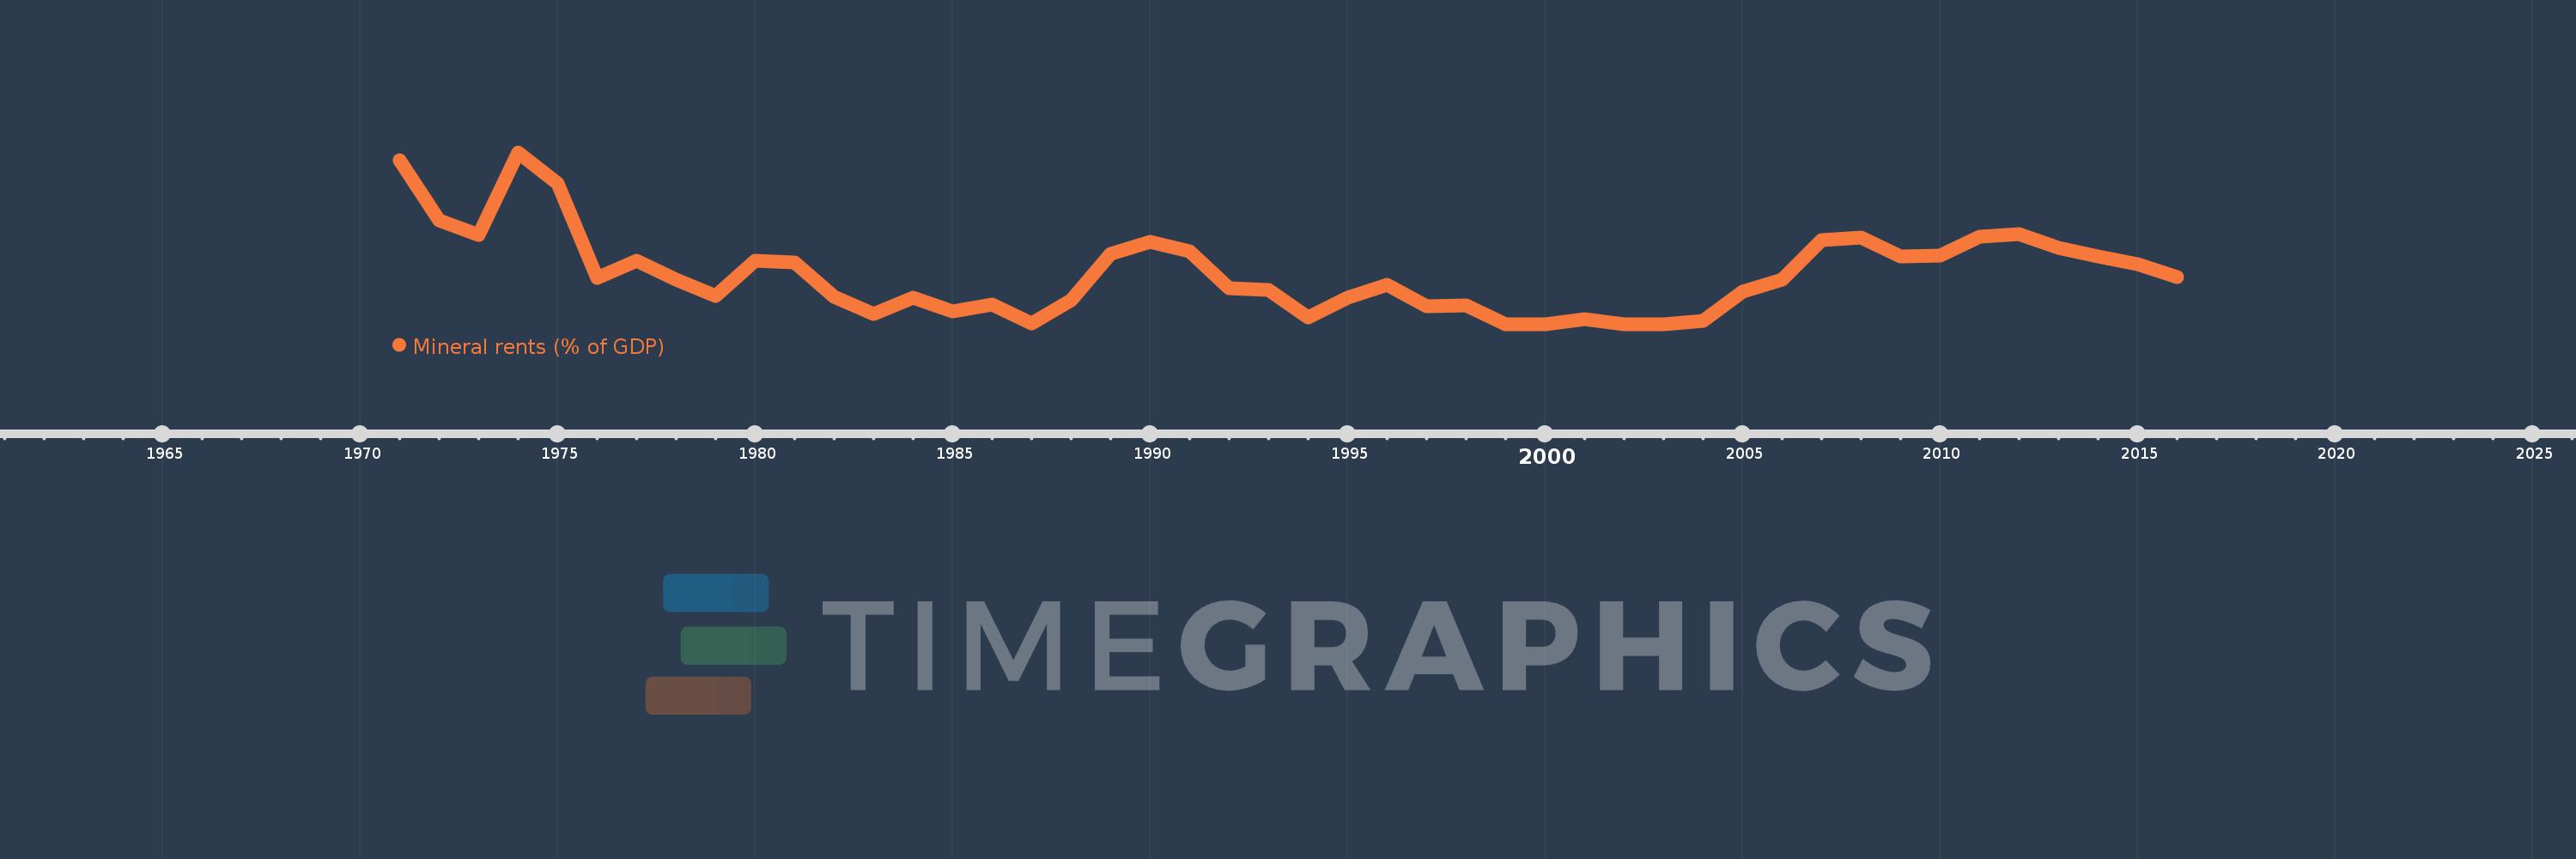
Mineral rents (% of GDP)
2016,2015,2014,2013,2012,2011,2010,2009,2008,2007,2006,2005,2004,2003,2002,2001,2000,1999,1998,1997,1996,1995,1994,1993,1992,1991,1990,1989,1988,1987,1986,1985,1984,1983,1982,1981,1980,1979,1978,1977,1976,1975,1974,1973,1972,1971
Estas estatísticas em outros países:
AfghanistanAlbaniaAlgeriaAndorraAngolaAntigua and BarbudaArab WorldArgentinaArmeniaArubaAustraliaAustriaAzerbaijanBahamas, TheBahrainBangladeshBarbadosBelarusBelgiumBelizeBeninBermudaBhutanBoliviaBosnia and HerzegovinaBotswanaBrazilBrunei DarussalamBulgariaBurkina FasoBurundiCabo VerdeCambodiaCameroonCanadaCaribbean small statesCayman IslandsCentral African RepublicCentral Europe and the BalticsChadChannel IslandsChileChinaColombiaComorosCongo, Dem. Rep.Congo, Rep.Costa RicaCote d'IvoireCroatiaCubaCyprusCzech RepublicDenmarkDjiboutiDominicaDominican RepublicEarly-demographic dividendEast Asia & PacificEast Asia & Pacific (excluding high income)East Asia & Pacific (IDA & IBRD countries)EcuadorEgypt, Arab Rep.El SalvadorEquatorial GuineaEritreaEstoniaEthiopiaEuro areaEurope & Central AsiaEurope & Central Asia (excluding high income)Europe & Central Asia (IDA & IBRD countries)European UnionFaroe IslandsFijiFinlandFragile and conflict affected situationsFranceFrench PolynesiaGabonGambia, TheGeorgiaGermanyGhanaGreeceGreenlandGrenadaGuatemalaGuineaGuinea-BissauGuyanaHaitiHeavily indebted poor countries (HIPC)High incomeHondurasHong Kong SAR, ChinaHungaryIBRD onlyIcelandIDA & IBRD totalIDA blendIDA onlyIDA totalIndiaIndonesiaIran, Islamic Rep.IraqIrelandIsle of ManIsraelItalyJamaicaJapanJordanKazakhstanKenyaKiribatiKorea, Rep.KosovoKuwaitKyrgyz RepublicLao PDRLate-demographic dividendLatin America & Caribbean Latin America & Caribbean (excluding high income)Latin America & the Caribbean (IDA & IBRD countries)LatviaLeast developed countries: UN classificationLebanonLesothoLiberiaLibyaLiechtensteinLithuaniaLow & middle incomeLow incomeLower middle incomeLuxembourgMacao SAR, ChinaMacedonia, FYRMadagascarMalawiMalaysiaMaldivesMaliMaltaMarshall IslandsMauritaniaMauritiusMexicoMicronesia, Fed. Sts.Middle East & North AfricaMiddle East & North Africa (excluding high income)Middle East & North Africa (IDA & IBRD countries)Middle incomeMoldovaMonacoMongoliaMontenegroMoroccoMozambiqueMyanmarNamibiaNepalNetherlandsNew CaledoniaNew ZealandNicaraguaNigerNigeriaNorth AmericaNorwayOECD membersOmanOther small statesPacific island small statesPakistanPalauPanamaPapua New GuineaParaguayPeruPhilippinesPolandPortugalPost-demographic dividendPre-demographic dividendPuerto RicoQatarRomaniaRussian FederationRwandaSamoaSan MarinoSao Tome and PrincipeSaudi ArabiaSenegalSerbiaSeychellesSierra LeoneSingaporeSlovak RepublicSloveniaSmall statesSolomon IslandsSomaliaSouth AfricaSouth AsiaSouth Asia (IDA & IBRD)South SudanSpainSri LankaSt. Kitts and NevisSt. LuciaSt. Vincent and the GrenadinesSub-Saharan Africa Sub-Saharan Africa (excluding high income)Sub-Saharan Africa (IDA & IBRD countries)SudanSurinameSwazilandSwedenSwitzerlandSyrian Arab RepublicTajikistanTanzaniaThailandTimor-LesteTogoTongaTrinidad and TobagoTunisiaTurkeyTurkmenistanTuvaluUgandaUkraineUnited Arab EmiratesUnited KingdomUnited StatesUpper middle incomeUruguayUzbekistanVanuatuVenezuela, RBVietnamVirgin Islands (U.S.)West Bank and GazaWorldYemen, Rep.ZambiaZimbabwe Linha do tempo:
Nesta escala de tempo está apresentado um gráfico de 1971 ano até 2016 ano Zambia. Dados de 1970 ano ausente. O número de observações reais por data: 46.
Fonte (nome):
Indicadores de desenvolvimento mundial
Fonte (organização):
Estimates based on sources and methods described in "The Changing Wealth of Nations: Measuring Sustainable Development in the New Millennium" (World Bank, 2011).
Categorias:
Energy & Mining, Environment
Foi atualizado:
23 abr 2017 ano
Indicadores de alterações dos valores ao longo dos anos
Máximo:
36.85
1 jan 1974 ano
Na data de observação
Valor
Mudança absoluta
A alteração em relação ao valor anterior
1 jan 1971 ano
35.206
+35.206
0.0%
1 jan 1972 ano
22.31
-12.896
-36.63%
1 jan 1973 ano
19.19
-3.12
-13.98%
1 jan 1974 ano
36.85
+17.66
92.02%
1 jan 1975 ano
30.171
-6.679
-18.13%
1 jan 1976 ano
9.901
-20.27
-67.18%
1 jan 1977 ano
13.683
+3.782
38.2%
1 jan 1978 ano
9.57
-4.113
-30.06%
1 jan 1979 ano
6.074
-3.496
-36.53%
1 jan 1980 ano
13.674
+7.601
125.13%
1 jan 1981 ano
13.183
-0.491
-3.59%
1 jan 1982 ano
5.946
-7.237
-54.9%
1 jan 1983 ano
2.235
-3.71
-62.4%
1 jan 1984 ano
5.679
+3.444
154.06%
1 jan 1985 ano
2.815
-2.864
-50.43%
1 jan 1986 ano
4.155
+1.34
47.59%
1 jan 1987 ano
0.094
-4.061
-97.73%
1 jan 1988 ano
5.104
+5.01
5.32 mil%
1 jan 1989 ano
15.025
+9.922
194.4%
1 jan 1990 ano
17.691
+2.666
17.74%
1 jan 1991 ano
15.601
-2.091
-11.82%
1 jan 1992 ano
7.742
-7.858
-50.37%
1 jan 1993 ano
7.434
-0.309
-3.98%
1 jan 1994 ano
1.45
-5.984
-80.49%
1 jan 1995 ano
5.706
+4.256
293.49%
1 jan 1996 ano
8.426
+2.72
47.68%
1 jan 1997 ano
3.817
-4.609
-54.69%
1 jan 1998 ano
3.948
+0.131
3.43%
1 jan 1999 ano
0.0
-3.948
-100.0%
1 jan 2001 ano
1.044
+1.044
%
1 jan 2002 ano
0.0
-1.044
-100.0%
1 jan 2004 ano
0.777
+0.777
%
1 jan 2005 ano
7.053
+6.276
808.1%
1 jan 2006 ano
9.592
+2.538
35.99%
1 jan 2007 ano
18.058
+8.466
88.27%
1 jan 2008 ano
18.651
+0.593
3.29%
1 jan 2009 ano
14.553
-4.098
-21.97%
1 jan 2010 ano
14.704
+0.151
1.03%
1 jan 2011 ano
18.709
+4.005
27.24%
1 jan 2012 ano
19.298
+0.589
3.15%
1 jan 2013 ano
16.295
-3.003
-15.56%
1 jan 2014 ano
14.487
-1.808
-11.09%
1 jan 2015 ano
12.805
-1.682
-11.61%
1 jan 2016 ano
10.089
-2.717
-21.22%
Classificação de países por estatísticas atuais por anos


Comentários: