29
/pt/
pt
AIzaSyAYiBZKx7MnpbEhh9jyipgxe19OcubqV5w
April 1, 2024
49092
Middle East & North Africa (excluding high income)
MNA
false
2
1
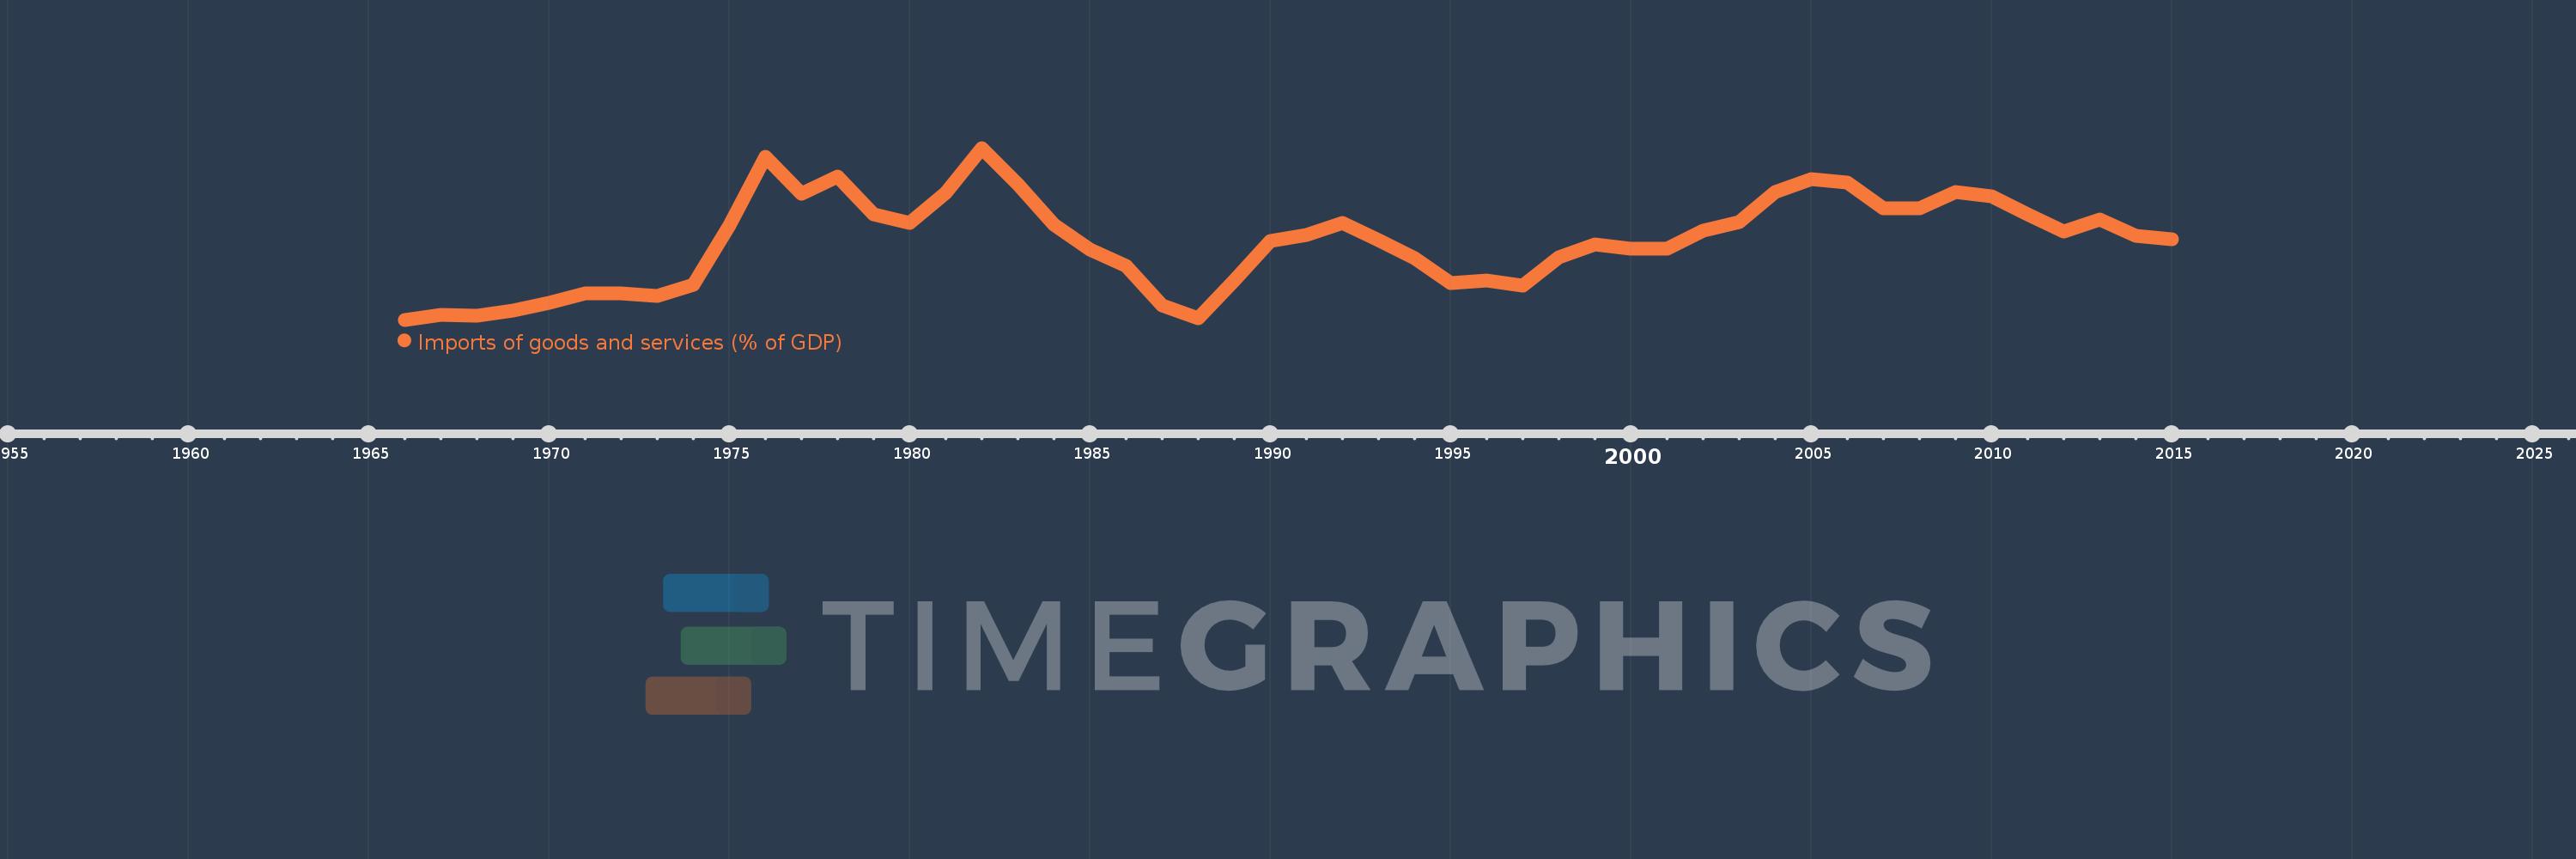
Imports of goods and services (% of GDP)
2015,2014,2013,2012,2011,2010,2009,2008,2007,2006,2005,2004,2003,2002,2001,2000,1999,1998,1997,1996,1995,1994,1993,1992,1991,1990,1989,1988,1987,1986,1985,1984,1983,1982,1981,1980,1979,1978,1977,1976,1975,1974,1973,1972,1971,1970,1969,1968,1967,1966
Estas estatísticas em outros países:
AfghanistanAlbaniaAlgeriaAngolaAntigua and BarbudaArab WorldArgentinaArmeniaArubaAustraliaAustriaAzerbaijanBahamas, TheBahrainBangladeshBarbadosBelarusBelgiumBelizeBeninBermudaBhutanBoliviaBosnia and HerzegovinaBotswanaBrazilBrunei DarussalamBulgariaBurkina FasoBurundiCabo VerdeCambodiaCameroonCanadaCaribbean small statesCentral African RepublicCentral Europe and the BalticsChadChileChinaColombiaComorosCongo, Dem. Rep.Congo, Rep.Costa RicaCote d'IvoireCroatiaCubaCyprusCzech RepublicDenmarkDjiboutiDominicaDominican RepublicEarly-demographic dividendEast Asia & PacificEast Asia & Pacific (excluding high income)East Asia & Pacific (IDA & IBRD countries)EcuadorEgypt, Arab Rep.El SalvadorEquatorial GuineaEritreaEstoniaEthiopiaEuro areaEurope & Central AsiaEurope & Central Asia (excluding high income)Europe & Central Asia (IDA & IBRD countries)European UnionFaroe IslandsFijiFinlandFragile and conflict affected situationsFranceFrench PolynesiaGabonGambia, TheGeorgiaGermanyGhanaGreeceGrenadaGuatemalaGuineaGuinea-BissauGuyanaHaitiHeavily indebted poor countries (HIPC)High incomeHondurasHong Kong SAR, ChinaHungaryIBRD onlyIcelandIDA & IBRD totalIDA blendIDA onlyIDA totalIndiaIndonesiaIran, Islamic Rep.IraqIrelandIsraelItalyJamaicaJapanJordanKazakhstanKenyaKiribatiKorea, Rep.KosovoKuwaitKyrgyz RepublicLao PDRLate-demographic dividendLatin America & Caribbean Latin America & Caribbean (excluding high income)Latin America & the Caribbean (IDA & IBRD countries)LatviaLeast developed countries: UN classificationLebanonLesothoLiberiaLibyaLithuaniaLow & middle incomeLow incomeLower middle incomeLuxembourgMacao SAR, ChinaMacedonia, FYRMadagascarMalawiMalaysiaMaldivesMaliMaltaMauritaniaMauritiusMexicoMicronesia, Fed. Sts.Middle East & North AfricaMiddle East & North Africa (excluding high income)Middle East & North Africa (IDA & IBRD countries)Middle incomeMoldovaMongoliaMontenegroMoroccoMozambiqueMyanmarNamibiaNepalNetherlandsNew CaledoniaNew ZealandNicaraguaNigerNigeriaNorth AmericaNorwayOECD membersOmanOther small statesPacific island small statesPakistanPalauPanamaPapua New GuineaParaguayPeruPhilippinesPolandPortugalPost-demographic dividendPre-demographic dividendPuerto RicoQatarRomaniaRussian FederationRwandaSamoaSaudi ArabiaSenegalSerbiaSeychellesSierra LeoneSingaporeSlovak RepublicSloveniaSmall statesSolomon IslandsSomaliaSouth AfricaSouth AsiaSouth Asia (IDA & IBRD)South SudanSpainSri LankaSt. Kitts and NevisSt. LuciaSt. Vincent and the GrenadinesSub-Saharan Africa Sub-Saharan Africa (excluding high income)Sub-Saharan Africa (IDA & IBRD countries)SudanSurinameSwazilandSwedenSwitzerlandSyrian Arab RepublicTajikistanTanzaniaThailandTimor-LesteTogoTongaTrinidad and TobagoTunisiaTurkeyTurkmenistanUgandaUkraineUnited Arab EmiratesUnited KingdomUnited StatesUpper middle incomeUruguayUzbekistanVanuatuVenezuela, RBVietnamWest Bank and GazaWorldYemen, Rep.ZambiaZimbabwe Linha do tempo:
Nesta escala de tempo está apresentado um gráfico de 1966 ano até 2015 ano Middle East & North Africa (excluding high income). Dados de 1965 ano ausente. O número de observações reais por data: 50.
Fonte (nome):
Indicadores de desenvolvimento mundial
Fonte (organização):
World Bank national accounts data, and OECD National Accounts data files.
Categorias:
Economy & Growth, Trade
Foi atualizado:
23 abr 2017 ano
Indicadores de alterações dos valores ao longo dos anos
Mínimo:
18.92
1 jan 1966 ano
Máximo:
39.08
1 jan 1982 ano
Na data de observação
Valor
Mudança absoluta
A alteração em relação ao valor anterior
1 jan 1966 ano
18.92
+18.92
0.0%
1 jan 1967 ano
19.489
+0.569
3.01%
1 jan 1968 ano
19.4
-0.089
-0.46%
1 jan 1969 ano
19.95
+0.55
2.83%
1 jan 1970 ano
20.947
+0.997
5.0%
1 jan 1971 ano
21.967
+1.02
4.87%
1 jan 1972 ano
22.062
+0.095
0.43%
1 jan 1973 ano
21.759
-0.303
-1.37%
1 jan 1974 ano
23.048
+1.289
5.92%
1 jan 1975 ano
30.027
+6.979
30.28%
1 jan 1976 ano
38.035
+8.008
26.67%
1 jan 1977 ano
33.689
-4.345
-11.42%
1 jan 1978 ano
35.69
+2.001
5.94%
1 jan 1979 ano
31.291
-4.399
-12.33%
1 jan 1980 ano
30.254
-1.037
-3.31%
1 jan 1981 ano
33.834
+3.58
11.83%
1 jan 1982 ano
39.08
+5.246
15.51%
1 jan 1983 ano
34.793
-4.287
-10.97%
1 jan 1984 ano
30.045
-4.748
-13.65%
1 jan 1985 ano
27.16
-2.885
-9.6%
1 jan 1986 ano
25.21
-1.951
-7.18%
1 jan 1987 ano
20.642
-4.568
-18.12%
1 jan 1988 ano
19.086
-1.556
-7.54%
1 jan 1989 ano
23.574
+4.488
23.51%
1 jan 1990 ano
28.198
+4.625
19.62%
1 jan 1991 ano
28.827
+0.628
2.23%
1 jan 1992 ano
30.321
+1.494
5.18%
1 jan 1993 ano
28.227
-2.094
-6.91%
1 jan 1994 ano
26.189
-2.038
-7.22%
1 jan 1995 ano
23.18
-3.009
-11.49%
1 jan 1996 ano
23.56
+0.38
1.64%
1 jan 1997 ano
22.911
-0.649
-2.75%
1 jan 1998 ano
26.269
+3.358
14.66%
1 jan 1999 ano
27.724
+1.455
5.54%
1 jan 2000 ano
27.221
-0.503
-1.81%
1 jan 2001 ano
27.27
+0.049
0.18%
1 jan 2002 ano
29.347
+2.077
7.62%
1 jan 2003 ano
30.337
+0.99
3.37%
1 jan 2004 ano
33.891
+3.554
11.72%
1 jan 2005 ano
35.404
+1.513
4.46%
1 jan 2006 ano
34.97
-0.434
-1.23%
1 jan 2007 ano
32.044
-2.926
-8.37%
1 jan 2008 ano
31.954
-0.089
-0.28%
1 jan 2009 ano
33.948
+1.994
6.24%
1 jan 2010 ano
33.427
-0.521
-1.54%
1 jan 2011 ano
31.269
-2.157
-6.45%
1 jan 2012 ano
29.311
-1.959
-6.26%
1 jan 2013 ano
30.714
+1.403
4.79%
1 jan 2014 ano
28.791
-1.923
-6.26%
1 jan 2015 ano
28.409
-0.382
-1.33%
Classificação de países por estatísticas atuais por anos


Comentários: