29
/pt/
pt
AIzaSyAYiBZKx7MnpbEhh9jyipgxe19OcubqV5w
April 1, 2024
201695
Morocco
MAR
true
2
1
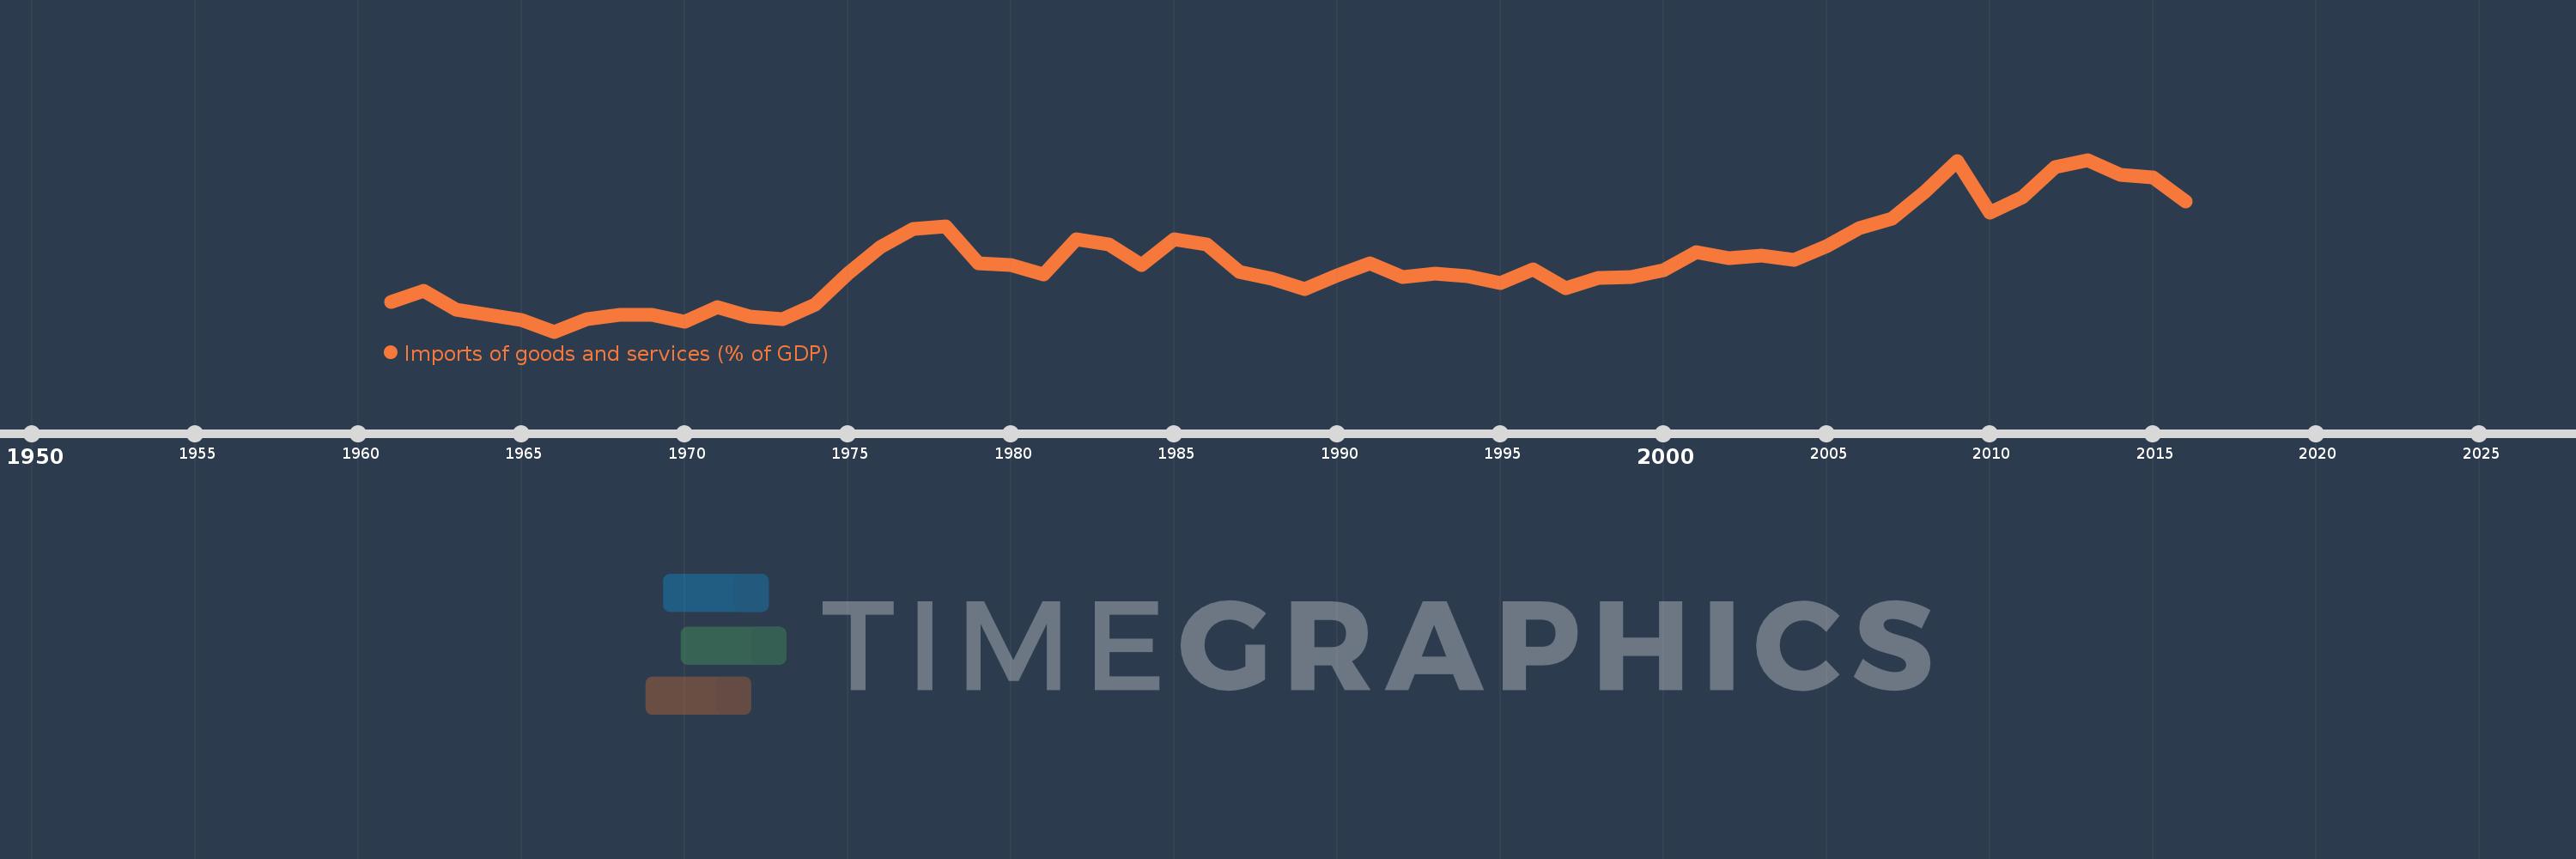
Imports of goods and services (% of GDP)
2016,2015,2014,2013,2012,2011,2010,2009,2008,2007,2006,2005,2004,2003,2002,2001,2000,1999,1998,1997,1996,1995,1994,1993,1992,1991,1990,1989,1988,1987,1986,1985,1984,1983,1982,1981,1980,1979,1978,1977,1976,1975,1974,1973,1972,1971,1970,1969,1968,1967,1966,1965,1964,1963,1962,1961
Estas estatísticas em outros países:
AfghanistanAlbaniaAlgeriaAngolaAntigua and BarbudaArab WorldArgentinaArmeniaArubaAustraliaAustriaAzerbaijanBahamas, TheBahrainBangladeshBarbadosBelarusBelgiumBelizeBeninBermudaBhutanBoliviaBosnia and HerzegovinaBotswanaBrazilBrunei DarussalamBulgariaBurkina FasoBurundiCabo VerdeCambodiaCameroonCanadaCaribbean small statesCentral African RepublicCentral Europe and the BalticsChadChileChinaColombiaComorosCongo, Dem. Rep.Congo, Rep.Costa RicaCote d'IvoireCroatiaCubaCyprusCzech RepublicDenmarkDjiboutiDominicaDominican RepublicEarly-demographic dividendEast Asia & PacificEast Asia & Pacific (excluding high income)East Asia & Pacific (IDA & IBRD countries)EcuadorEgypt, Arab Rep.El SalvadorEquatorial GuineaEritreaEstoniaEthiopiaEuro areaEurope & Central AsiaEurope & Central Asia (excluding high income)Europe & Central Asia (IDA & IBRD countries)European UnionFaroe IslandsFijiFinlandFragile and conflict affected situationsFranceFrench PolynesiaGabonGambia, TheGeorgiaGermanyGhanaGreeceGrenadaGuatemalaGuineaGuinea-BissauGuyanaHaitiHeavily indebted poor countries (HIPC)High incomeHondurasHong Kong SAR, ChinaHungaryIBRD onlyIcelandIDA & IBRD totalIDA blendIDA onlyIDA totalIndiaIndonesiaIran, Islamic Rep.IraqIrelandIsraelItalyJamaicaJapanJordanKazakhstanKenyaKiribatiKorea, Rep.KosovoKuwaitKyrgyz RepublicLao PDRLate-demographic dividendLatin America & Caribbean Latin America & Caribbean (excluding high income)Latin America & the Caribbean (IDA & IBRD countries)LatviaLeast developed countries: UN classificationLebanonLesothoLiberiaLibyaLithuaniaLow & middle incomeLow incomeLower middle incomeLuxembourgMacao SAR, ChinaMacedonia, FYRMadagascarMalawiMalaysiaMaldivesMaliMaltaMauritaniaMauritiusMexicoMicronesia, Fed. Sts.Middle East & North AfricaMiddle East & North Africa (excluding high income)Middle East & North Africa (IDA & IBRD countries)Middle incomeMoldovaMongoliaMontenegroMoroccoMozambiqueMyanmarNamibiaNepalNetherlandsNew CaledoniaNew ZealandNicaraguaNigerNigeriaNorth AmericaNorwayOECD membersOmanOther small statesPacific island small statesPakistanPalauPanamaPapua New GuineaParaguayPeruPhilippinesPolandPortugalPost-demographic dividendPre-demographic dividendPuerto RicoQatarRomaniaRussian FederationRwandaSamoaSaudi ArabiaSenegalSerbiaSeychellesSierra LeoneSingaporeSlovak RepublicSloveniaSmall statesSolomon IslandsSomaliaSouth AfricaSouth AsiaSouth Asia (IDA & IBRD)South SudanSpainSri LankaSt. Kitts and NevisSt. LuciaSt. Vincent and the GrenadinesSub-Saharan Africa Sub-Saharan Africa (excluding high income)Sub-Saharan Africa (IDA & IBRD countries)SudanSurinameSwazilandSwedenSwitzerlandSyrian Arab RepublicTajikistanTanzaniaThailandTimor-LesteTogoTongaTrinidad and TobagoTunisiaTurkeyTurkmenistanUgandaUkraineUnited Arab EmiratesUnited KingdomUnited StatesUpper middle incomeUruguayUzbekistanVanuatuVenezuela, RBVietnamWest Bank and GazaWorldYemen, Rep.ZambiaZimbabwe Linha do tempo:
Nesta escala de tempo está apresentado um gráfico de 1961 ano até 2016 ano Morocco. Dados de 1960 ano ausente. O número de observações reais por data: 56.
Fonte (nome):
Indicadores de desenvolvimento mundial
Fonte (organização):
World Bank national accounts data, and OECD National Accounts data files.
Categorias:
Economy & Growth, Trade
Foi atualizado:
23 abr 2017 ano
Indicadores de alterações dos valores ao longo dos anos
Mínimo:
16.89
1 jan 1966 ano
Máximo:
50.195
1 jan 2013 ano
Na data de observação
Valor
Mudança absoluta
A alteração em relação ao valor anterior
1 jan 1961 ano
22.699
+22.699
0.0%
1 jan 1962 ano
24.778
+2.079
9.16%
1 jan 1963 ano
21.093
-3.685
-14.87%
1 jan 1964 ano
20.079
-1.014
-4.81%
1 jan 1965 ano
19.137
-0.942
-4.69%
1 jan 1966 ano
16.89
-2.247
-11.74%
1 jan 1967 ano
19.373
+2.483
14.7%
1 jan 1968 ano
20.174
+0.8
4.13%
1 jan 1969 ano
20.054
-0.119
-0.59%
1 jan 1970 ano
18.832
-1.222
-6.09%
1 jan 1971 ano
21.579
+2.747
14.59%
1 jan 1972 ano
19.726
-1.853
-8.59%
1 jan 1973 ano
19.223
-0.503
-2.55%
1 jan 1974 ano
22.106
+2.883
15.0%
1 jan 1975 ano
28.193
+6.087
27.53%
1 jan 1976 ano
33.346
+5.153
18.28%
1 jan 1977 ano
36.729
+3.383
10.15%
1 jan 1978 ano
37.321
+0.592
1.61%
1 jan 1979 ano
30.068
-7.253
-19.43%
1 jan 1980 ano
29.865
-0.204
-0.68%
1 jan 1981 ano
28.006
-1.858
-6.22%
1 jan 1982 ano
34.765
+6.759
24.13%
1 jan 1983 ano
33.736
-1.029
-2.96%
1 jan 1984 ano
29.859
-3.876
-11.49%
1 jan 1985 ano
34.729
+4.869
16.31%
1 jan 1986 ano
33.802
-0.927
-2.67%
1 jan 1987 ano
28.398
-5.404
-15.99%
1 jan 1988 ano
27.176
-1.222
-4.3%
1 jan 1989 ano
25.141
-2.035
-7.49%
1 jan 1990 ano
27.796
+2.655
10.56%
1 jan 1991 ano
30.067
+2.271
8.17%
1 jan 1992 ano
27.461
-2.607
-8.67%
1 jan 1993 ano
28.091
+0.631
2.3%
1 jan 1994 ano
27.608
-0.483
-1.72%
1 jan 1995 ano
26.375
-1.233
-4.46%
1 jan 1996 ano
29.042
+2.667
10.11%
1 jan 1997 ano
25.26
-3.782
-13.02%
1 jan 1998 ano
27.226
+1.966
7.79%
1 jan 1999 ano
27.394
+0.168
0.62%
1 jan 2000 ano
28.832
+1.438
5.25%
1 jan 2001 ano
32.374
+3.542
12.29%
1 jan 2002 ano
31.209
-1.166
-3.6%
1 jan 2003 ano
31.616
+0.408
1.31%
1 jan 2004 ano
30.824
-0.792
-2.51%
1 jan 2005 ano
33.489
+2.665
8.65%
1 jan 2006 ano
36.996
+3.507
10.47%
1 jan 2007 ano
38.741
+1.745
4.72%
1 jan 2008 ano
43.915
+5.174
13.36%
1 jan 2009 ano
49.93
+6.015
13.7%
1 jan 2010 ano
39.912
-10.019
-20.06%
1 jan 2011 ano
43.015
+3.103
7.77%
1 jan 2012 ano
48.727
+5.712
13.28%
1 jan 2013 ano
50.195
+1.469
3.01%
1 jan 2014 ano
47.243
-2.952
-5.88%
1 jan 2015 ano
46.844
-0.398
-0.84%
1 jan 2016 ano
42.085
-4.759
-10.16%
Classificação de países por estatísticas atuais por anos


Comentários: