29
/pt/
pt
AIzaSyAYiBZKx7MnpbEhh9jyipgxe19OcubqV5w
April 1, 2024
148055
Guyana
GUY
true
2
1
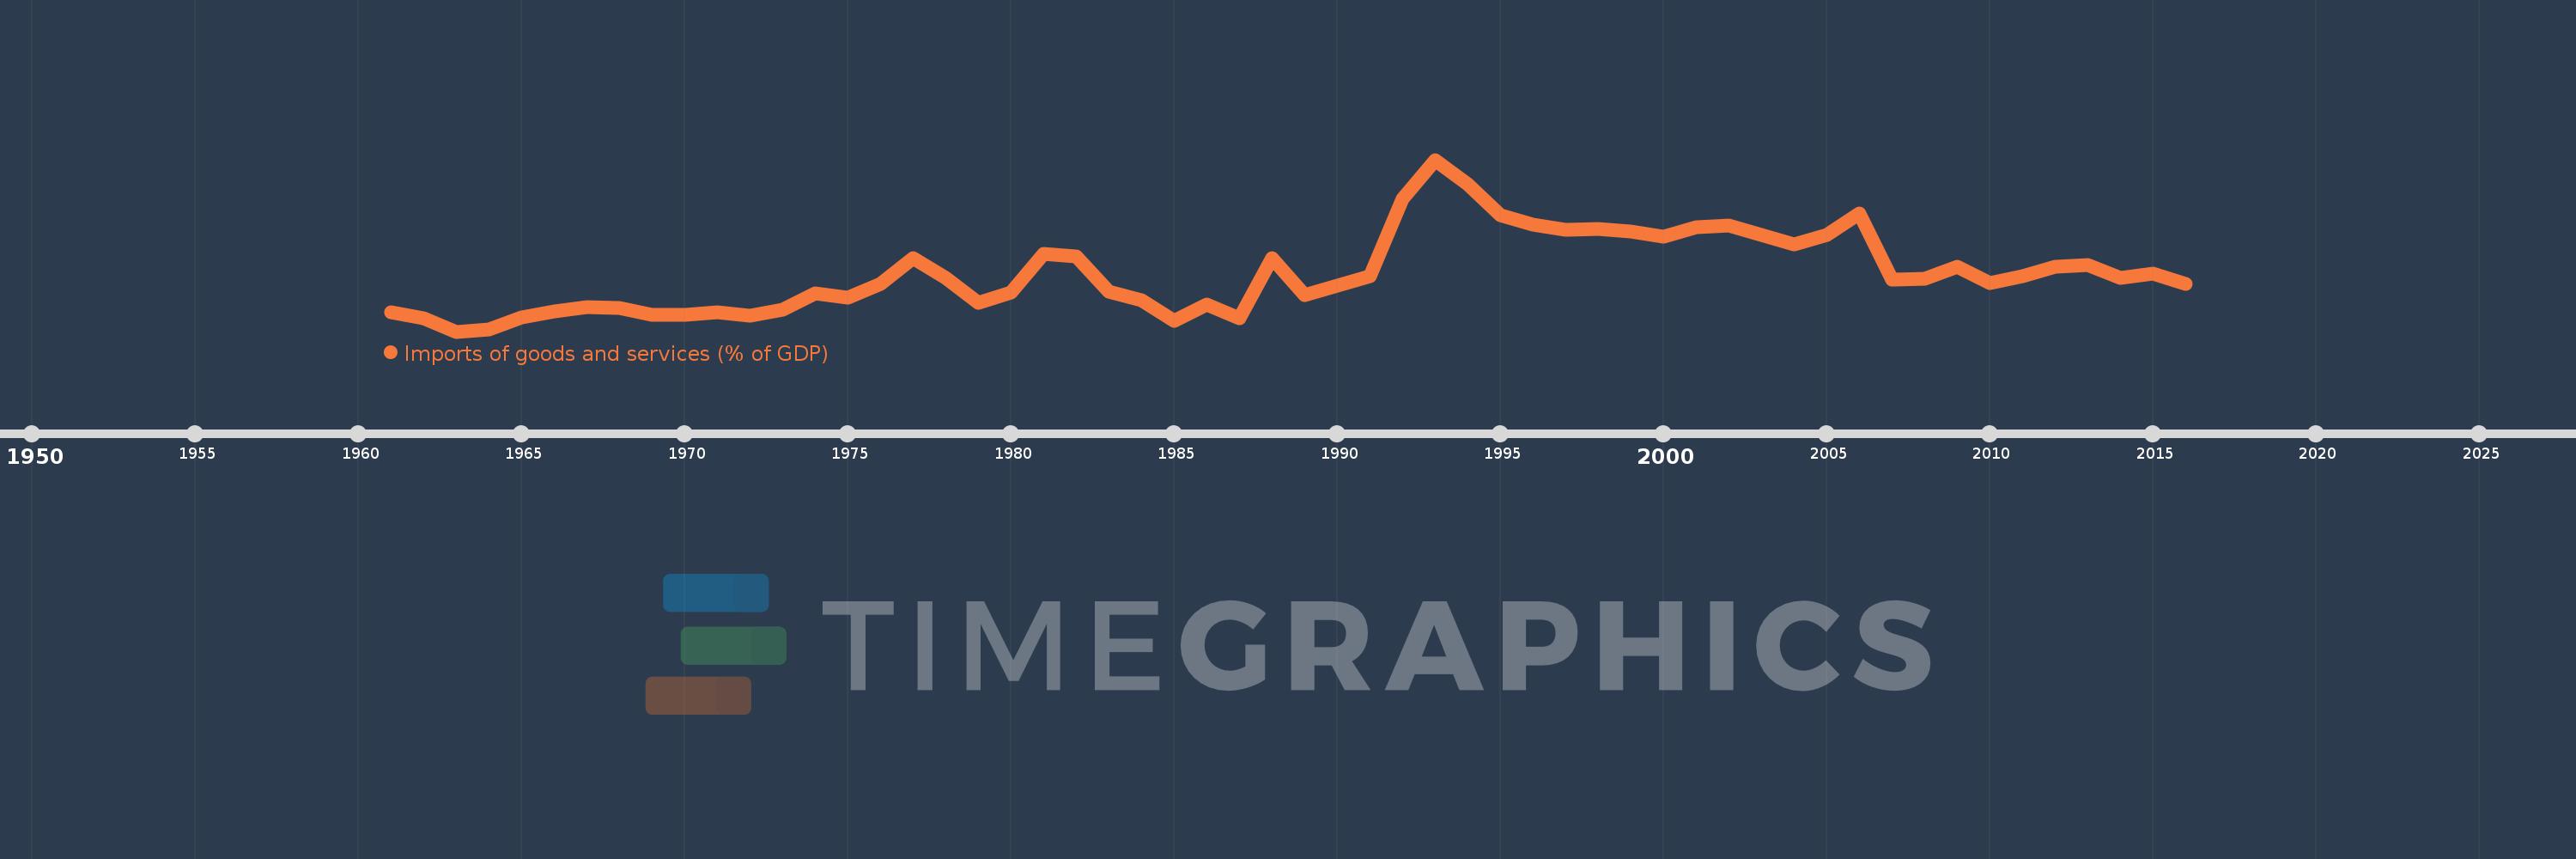
Imports of goods and services (% of GDP)
2016,2015,2014,2013,2012,2011,2010,2009,2008,2007,2006,2005,2004,2003,2002,2001,2000,1999,1998,1997,1996,1995,1994,1993,1992,1991,1990,1989,1988,1987,1986,1985,1984,1983,1982,1981,1980,1979,1978,1977,1976,1975,1974,1973,1972,1971,1970,1969,1968,1967,1966,1965,1964,1963,1962,1961
Estas estatísticas em outros países:
AfghanistanAlbaniaAlgeriaAngolaAntigua and BarbudaArab WorldArgentinaArmeniaArubaAustraliaAustriaAzerbaijanBahamas, TheBahrainBangladeshBarbadosBelarusBelgiumBelizeBeninBermudaBhutanBoliviaBosnia and HerzegovinaBotswanaBrazilBrunei DarussalamBulgariaBurkina FasoBurundiCabo VerdeCambodiaCameroonCanadaCaribbean small statesCentral African RepublicCentral Europe and the BalticsChadChileChinaColombiaComorosCongo, Dem. Rep.Congo, Rep.Costa RicaCote d'IvoireCroatiaCubaCyprusCzech RepublicDenmarkDjiboutiDominicaDominican RepublicEarly-demographic dividendEast Asia & PacificEast Asia & Pacific (excluding high income)East Asia & Pacific (IDA & IBRD countries)EcuadorEgypt, Arab Rep.El SalvadorEquatorial GuineaEritreaEstoniaEthiopiaEuro areaEurope & Central AsiaEurope & Central Asia (excluding high income)Europe & Central Asia (IDA & IBRD countries)European UnionFaroe IslandsFijiFinlandFragile and conflict affected situationsFranceFrench PolynesiaGabonGambia, TheGeorgiaGermanyGhanaGreeceGrenadaGuatemalaGuineaGuinea-BissauGuyanaHaitiHeavily indebted poor countries (HIPC)High incomeHondurasHong Kong SAR, ChinaHungaryIBRD onlyIcelandIDA & IBRD totalIDA blendIDA onlyIDA totalIndiaIndonesiaIran, Islamic Rep.IraqIrelandIsraelItalyJamaicaJapanJordanKazakhstanKenyaKiribatiKorea, Rep.KosovoKuwaitKyrgyz RepublicLao PDRLate-demographic dividendLatin America & Caribbean Latin America & Caribbean (excluding high income)Latin America & the Caribbean (IDA & IBRD countries)LatviaLeast developed countries: UN classificationLebanonLesothoLiberiaLibyaLithuaniaLow & middle incomeLow incomeLower middle incomeLuxembourgMacao SAR, ChinaMacedonia, FYRMadagascarMalawiMalaysiaMaldivesMaliMaltaMauritaniaMauritiusMexicoMicronesia, Fed. Sts.Middle East & North AfricaMiddle East & North Africa (excluding high income)Middle East & North Africa (IDA & IBRD countries)Middle incomeMoldovaMongoliaMontenegroMoroccoMozambiqueMyanmarNamibiaNepalNetherlandsNew CaledoniaNew ZealandNicaraguaNigerNigeriaNorth AmericaNorwayOECD membersOmanOther small statesPacific island small statesPakistanPalauPanamaPapua New GuineaParaguayPeruPhilippinesPolandPortugalPost-demographic dividendPre-demographic dividendPuerto RicoQatarRomaniaRussian FederationRwandaSamoaSaudi ArabiaSenegalSerbiaSeychellesSierra LeoneSingaporeSlovak RepublicSloveniaSmall statesSolomon IslandsSomaliaSouth AfricaSouth AsiaSouth Asia (IDA & IBRD)South SudanSpainSri LankaSt. Kitts and NevisSt. LuciaSt. Vincent and the GrenadinesSub-Saharan Africa Sub-Saharan Africa (excluding high income)Sub-Saharan Africa (IDA & IBRD countries)SudanSurinameSwazilandSwedenSwitzerlandSyrian Arab RepublicTajikistanTanzaniaThailandTimor-LesteTogoTongaTrinidad and TobagoTunisiaTurkeyTurkmenistanUgandaUkraineUnited Arab EmiratesUnited KingdomUnited StatesUpper middle incomeUruguayUzbekistanVanuatuVenezuela, RBVietnamWest Bank and GazaWorldYemen, Rep.ZambiaZimbabwe Linha do tempo:
Nesta escala de tempo está apresentado um gráfico de 1961 ano até 2016 ano Guyana. Dados de 1960 ano ausente. O número de observações reais por data: 56.
Fonte (nome):
Indicadores de desenvolvimento mundial
Fonte (organização):
World Bank national accounts data, and OECD National Accounts data files.
Categorias:
Economy & Growth, Trade
Foi atualizado:
23 abr 2017 ano
Indicadores de alterações dos valores ao longo dos anos
Mínimo:
44.883
1 jan 1963 ano
Máximo:
152.806
1 jan 1993 ano
Na data de observação
Valor
Mudança absoluta
A alteração em relação ao valor anterior
1 jan 1961 ano
56.957
+56.957
0.0%
1 jan 1962 ano
52.982
-3.975
-6.98%
1 jan 1963 ano
44.883
-8.098
-15.29%
1 jan 1964 ano
46.133
+1.25
2.79%
1 jan 1965 ano
53.519
+7.386
16.01%
1 jan 1966 ano
57.655
+4.136
7.73%
1 jan 1967 ano
60.159
+2.504
4.34%
1 jan 1968 ano
59.793
-0.366
-0.61%
1 jan 1969 ano
55.147
-4.646
-7.77%
1 jan 1970 ano
55.435
+0.288
0.52%
1 jan 1971 ano
57.001
+1.566
2.83%
1 jan 1972 ano
54.689
-2.313
-4.06%
1 jan 1973 ano
58.769
+4.08
7.46%
1 jan 1974 ano
68.89
+10.121
17.22%
1 jan 1975 ano
66.419
-2.471
-3.59%
1 jan 1976 ano
74.905
+8.486
12.78%
1 jan 1977 ano
91.004
+16.099
21.49%
1 jan 1978 ano
78.768
-12.237
-13.45%
1 jan 1979 ano
63.099
-15.669
-19.89%
1 jan 1980 ano
69.226
+6.127
9.71%
1 jan 1981 ano
93.641
+24.415
35.27%
1 jan 1982 ano
92.311
-1.33
-1.42%
1 jan 1983 ano
70.083
-22.228
-24.08%
1 jan 1984 ano
64.578
-5.505
-7.86%
1 jan 1985 ano
51.359
-13.219
-20.47%
1 jan 1986 ano
61.882
+10.523
20.49%
1 jan 1987 ano
53.212
-8.67
-14.01%
1 jan 1988 ano
90.763
+37.551
70.57%
1 jan 1989 ano
67.931
-22.831
-25.15%
1 jan 1990 ano
73.533
+5.602
8.25%
1 jan 1991 ano
79.86
+6.326
8.6%
1 jan 1992 ano
128.034
+48.174
60.32%
1 jan 1993 ano
152.806
+24.772
19.35%
1 jan 1994 ano
137.226
-15.58
-10.2%
1 jan 1995 ano
117.93
-19.296
-14.06%
1 jan 1996 ano
112.117
-5.813
-4.93%
1 jan 1997 ano
108.716
-3.4
-3.03%
1 jan 1998 ano
109.477
+0.76
0.7%
1 jan 1999 ano
107.91
-1.566
-1.43%
1 jan 2000 ano
104.551
-3.36
-3.11%
1 jan 2001 ano
110.689
+6.138
5.87%
1 jan 2002 ano
111.419
+0.73
0.66%
1 jan 2003 ano
105.46
-5.958
-5.35%
1 jan 2004 ano
99.791
-5.67
-5.38%
1 jan 2005 ano
105.657
+5.867
5.88%
1 jan 2006 ano
119.207
+13.549
12.82%
1 jan 2007 ano
77.67
-41.536
-34.84%
1 jan 2008 ano
77.915
+0.245
0.32%
1 jan 2009 ano
85.797
+7.882
10.12%
1 jan 2010 ano
75.175
-10.622
-12.38%
1 jan 2011 ano
79.595
+4.42
5.88%
1 jan 2012 ano
85.446
+5.851
7.35%
1 jan 2013 ano
86.815
+1.369
1.6%
1 jan 2014 ano
78.595
-8.22
-9.47%
1 jan 2015 ano
81.345
+2.75
3.5%
1 jan 2016 ano
74.833
-6.513
-8.01%
Classificação de países por estatísticas atuais por anos


Comentários: