29
/pt/
pt
AIzaSyAYiBZKx7MnpbEhh9jyipgxe19OcubqV5w
April 1, 2024
191518
Malta
MLT
true
2
1
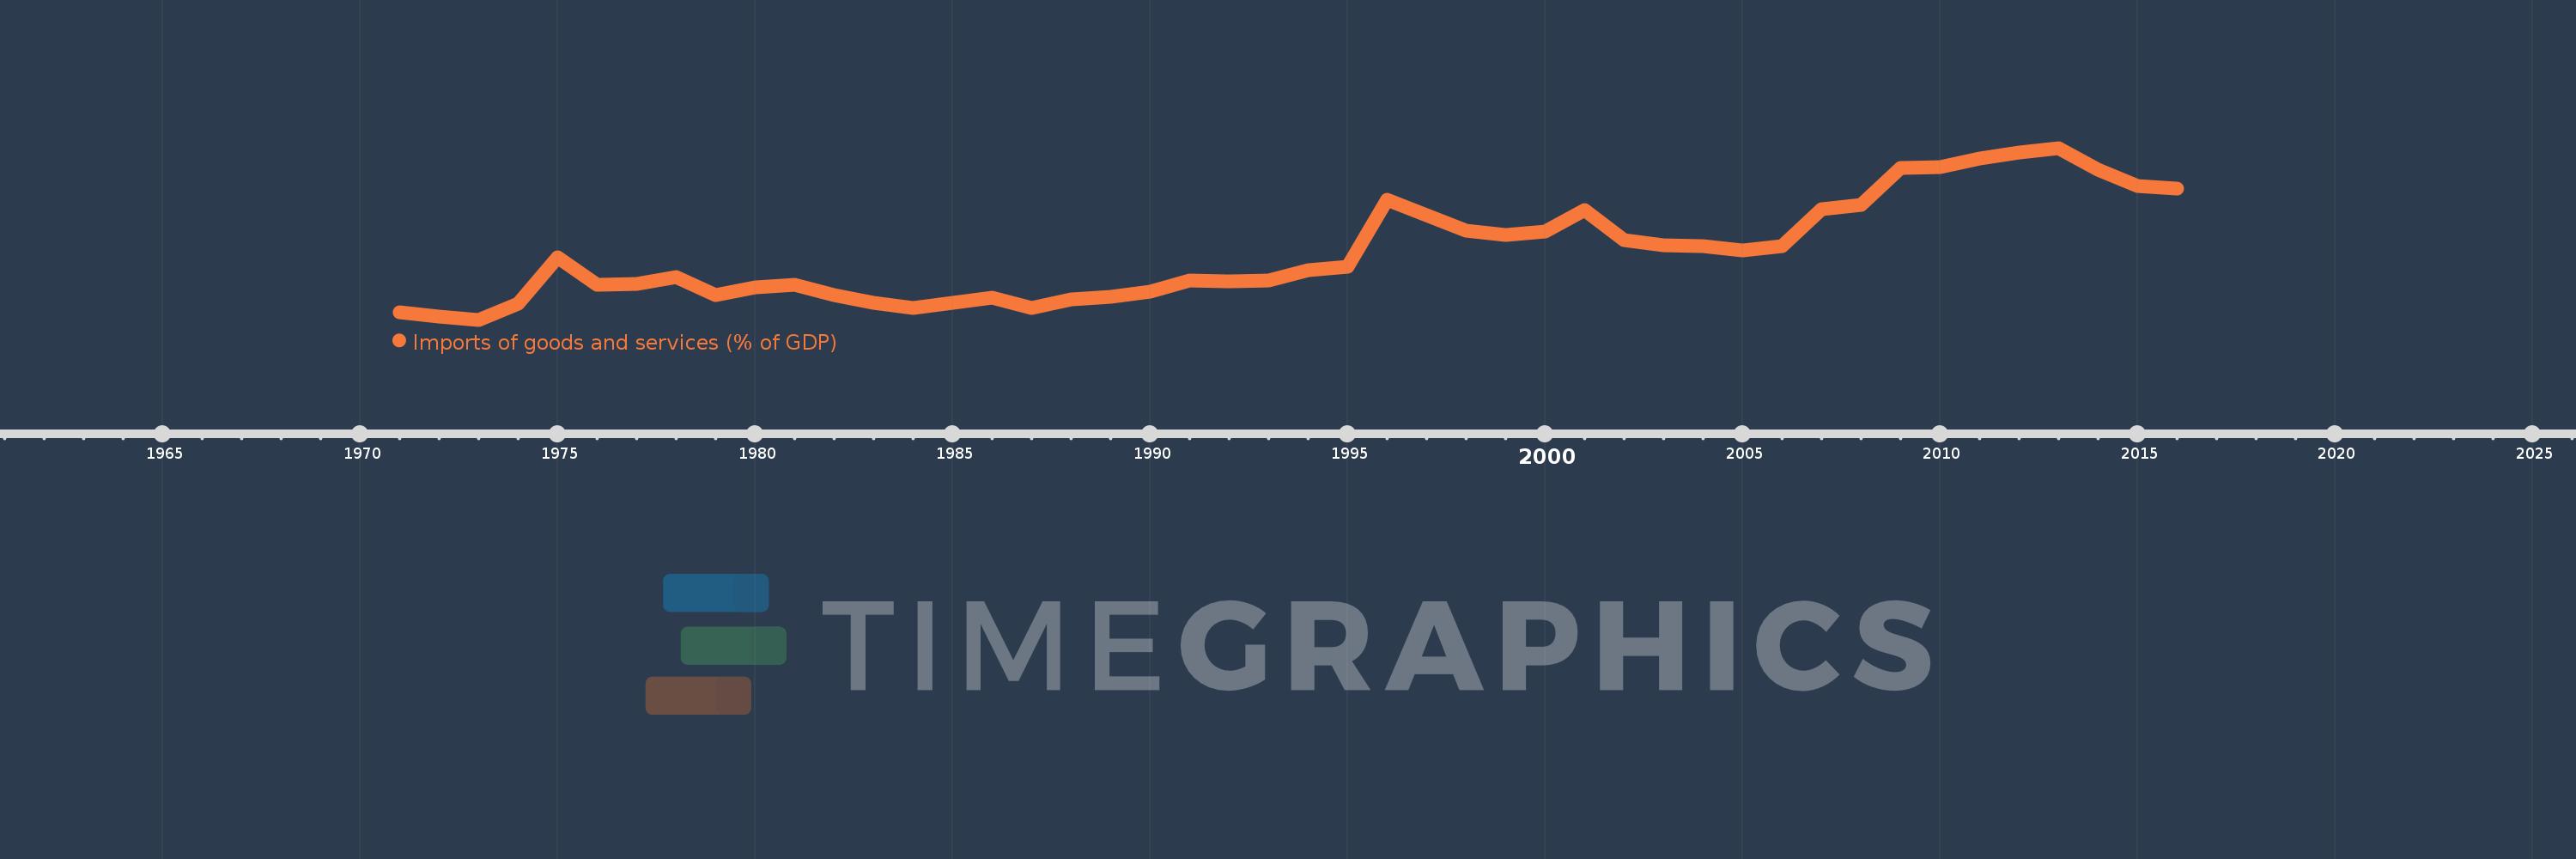
Imports of goods and services (% of GDP)
2016,2015,2014,2013,2012,2011,2010,2009,2008,2007,2006,2005,2004,2003,2002,2001,2000,1999,1998,1997,1996,1995,1994,1993,1992,1991,1990,1989,1988,1987,1986,1985,1984,1983,1982,1981,1980,1979,1978,1977,1976,1975,1974,1973,1972,1971
Estas estatísticas em outros países:
AfghanistanAlbaniaAlgeriaAngolaAntigua and BarbudaArab WorldArgentinaArmeniaArubaAustraliaAustriaAzerbaijanBahamas, TheBahrainBangladeshBarbadosBelarusBelgiumBelizeBeninBermudaBhutanBoliviaBosnia and HerzegovinaBotswanaBrazilBrunei DarussalamBulgariaBurkina FasoBurundiCabo VerdeCambodiaCameroonCanadaCaribbean small statesCentral African RepublicCentral Europe and the BalticsChadChileChinaColombiaComorosCongo, Dem. Rep.Congo, Rep.Costa RicaCote d'IvoireCroatiaCubaCyprusCzech RepublicDenmarkDjiboutiDominicaDominican RepublicEarly-demographic dividendEast Asia & PacificEast Asia & Pacific (excluding high income)East Asia & Pacific (IDA & IBRD countries)EcuadorEgypt, Arab Rep.El SalvadorEquatorial GuineaEritreaEstoniaEthiopiaEuro areaEurope & Central AsiaEurope & Central Asia (excluding high income)Europe & Central Asia (IDA & IBRD countries)European UnionFaroe IslandsFijiFinlandFragile and conflict affected situationsFranceFrench PolynesiaGabonGambia, TheGeorgiaGermanyGhanaGreeceGrenadaGuatemalaGuineaGuinea-BissauGuyanaHaitiHeavily indebted poor countries (HIPC)High incomeHondurasHong Kong SAR, ChinaHungaryIBRD onlyIcelandIDA & IBRD totalIDA blendIDA onlyIDA totalIndiaIndonesiaIran, Islamic Rep.IraqIrelandIsraelItalyJamaicaJapanJordanKazakhstanKenyaKiribatiKorea, Rep.KosovoKuwaitKyrgyz RepublicLao PDRLate-demographic dividendLatin America & Caribbean Latin America & Caribbean (excluding high income)Latin America & the Caribbean (IDA & IBRD countries)LatviaLeast developed countries: UN classificationLebanonLesothoLiberiaLibyaLithuaniaLow & middle incomeLow incomeLower middle incomeLuxembourgMacao SAR, ChinaMacedonia, FYRMadagascarMalawiMalaysiaMaldivesMaliMaltaMauritaniaMauritiusMexicoMicronesia, Fed. Sts.Middle East & North AfricaMiddle East & North Africa (excluding high income)Middle East & North Africa (IDA & IBRD countries)Middle incomeMoldovaMongoliaMontenegroMoroccoMozambiqueMyanmarNamibiaNepalNetherlandsNew CaledoniaNew ZealandNicaraguaNigerNigeriaNorth AmericaNorwayOECD membersOmanOther small statesPacific island small statesPakistanPalauPanamaPapua New GuineaParaguayPeruPhilippinesPolandPortugalPost-demographic dividendPre-demographic dividendPuerto RicoQatarRomaniaRussian FederationRwandaSamoaSaudi ArabiaSenegalSerbiaSeychellesSierra LeoneSingaporeSlovak RepublicSloveniaSmall statesSolomon IslandsSomaliaSouth AfricaSouth AsiaSouth Asia (IDA & IBRD)South SudanSpainSri LankaSt. Kitts and NevisSt. LuciaSt. Vincent and the GrenadinesSub-Saharan Africa Sub-Saharan Africa (excluding high income)Sub-Saharan Africa (IDA & IBRD countries)SudanSurinameSwazilandSwedenSwitzerlandSyrian Arab RepublicTajikistanTanzaniaThailandTimor-LesteTogoTongaTrinidad and TobagoTunisiaTurkeyTurkmenistanUgandaUkraineUnited Arab EmiratesUnited KingdomUnited StatesUpper middle incomeUruguayUzbekistanVanuatuVenezuela, RBVietnamWest Bank and GazaWorldYemen, Rep.ZambiaZimbabwe Linha do tempo:
Nesta escala de tempo está apresentado um gráfico de 1971 ano até 2016 ano Malta. Dados de 1970 ano ausente. O número de observações reais por data: 46.
Fonte (nome):
Indicadores de desenvolvimento mundial
Fonte (organização):
World Bank national accounts data, and OECD National Accounts data files.
Categorias:
Economy & Growth, Trade
Foi atualizado:
23 abr 2017 ano
Indicadores de alterações dos valores ao longo dos anos
Mínimo:
67.459
1 jan 1973 ano
Máximo:
159.692
1 jan 2013 ano
Na data de observação
Valor
Mudança absoluta
A alteração em relação ao valor anterior
1 jan 1971 ano
71.359
+71.359
0.0%
1 jan 1972 ano
68.939
-2.42
-3.39%
1 jan 1973 ano
67.459
-1.48
-2.15%
1 jan 1974 ano
75.912
+8.453
12.53%
1 jan 1975 ano
101.081
+25.169
33.16%
1 jan 1976 ano
86.332
-14.748
-14.59%
1 jan 1977 ano
86.491
+0.159
0.18%
1 jan 1978 ano
90.429
+3.938
4.55%
1 jan 1979 ano
80.532
-9.897
-10.94%
1 jan 1980 ano
84.619
+4.087
5.08%
1 jan 1981 ano
86.406
+1.787
2.11%
1 jan 1982 ano
80.57
-5.836
-6.75%
1 jan 1983 ano
76.561
-4.01
-4.98%
1 jan 1984 ano
73.658
-2.902
-3.79%
1 jan 1985 ano
76.476
+2.818
3.83%
1 jan 1986 ano
79.152
+2.676
3.5%
1 jan 1987 ano
73.825
-5.328
-6.73%
1 jan 1988 ano
78.468
+4.643
6.29%
1 jan 1989 ano
79.913
+1.445
1.84%
1 jan 1990 ano
82.468
+2.555
3.2%
1 jan 1991 ano
88.65
+6.182
7.5%
1 jan 1992 ano
87.866
-0.784
-0.88%
1 jan 1993 ano
88.706
+0.84
0.96%
1 jan 1994 ano
94.093
+5.387
6.07%
1 jan 1995 ano
95.74
+1.647
1.75%
1 jan 1996 ano
131.704
+35.964
37.56%
1 jan 1997 ano
123.465
-8.238
-6.26%
1 jan 1998 ano
115.486
-7.98
-6.46%
1 jan 1999 ano
112.97
-2.516
-2.18%
1 jan 2000 ano
114.659
+1.689
1.5%
1 jan 2001 ano
126.528
+11.869
10.35%
1 jan 2002 ano
110.163
-16.366
-12.93%
1 jan 2003 ano
107.228
-2.935
-2.66%
1 jan 2004 ano
106.851
-0.377
-0.35%
1 jan 2005 ano
104.793
-2.058
-1.93%
1 jan 2006 ano
106.816
+2.023
1.93%
1 jan 2007 ano
126.83
+20.014
18.74%
1 jan 2008 ano
128.973
+2.142
1.69%
1 jan 2009 ano
148.725
+19.752
15.32%
1 jan 2010 ano
149.239
+0.514
0.35%
1 jan 2011 ano
154.166
+4.927
3.3%
1 jan 2012 ano
157.105
+2.939
1.91%
1 jan 2013 ano
159.692
+2.587
1.65%
1 jan 2014 ano
148.197
-11.496
-7.2%
1 jan 2015 ano
139.449
-8.747
-5.9%
1 jan 2016 ano
137.687
-1.762
-1.26%
Classificação de países por estatísticas atuais por anos


Comentários: