29
/pt/
pt
AIzaSyAYiBZKx7MnpbEhh9jyipgxe19OcubqV5w
April 1, 2024
45121
Low & middle income
LMY
false
2
1
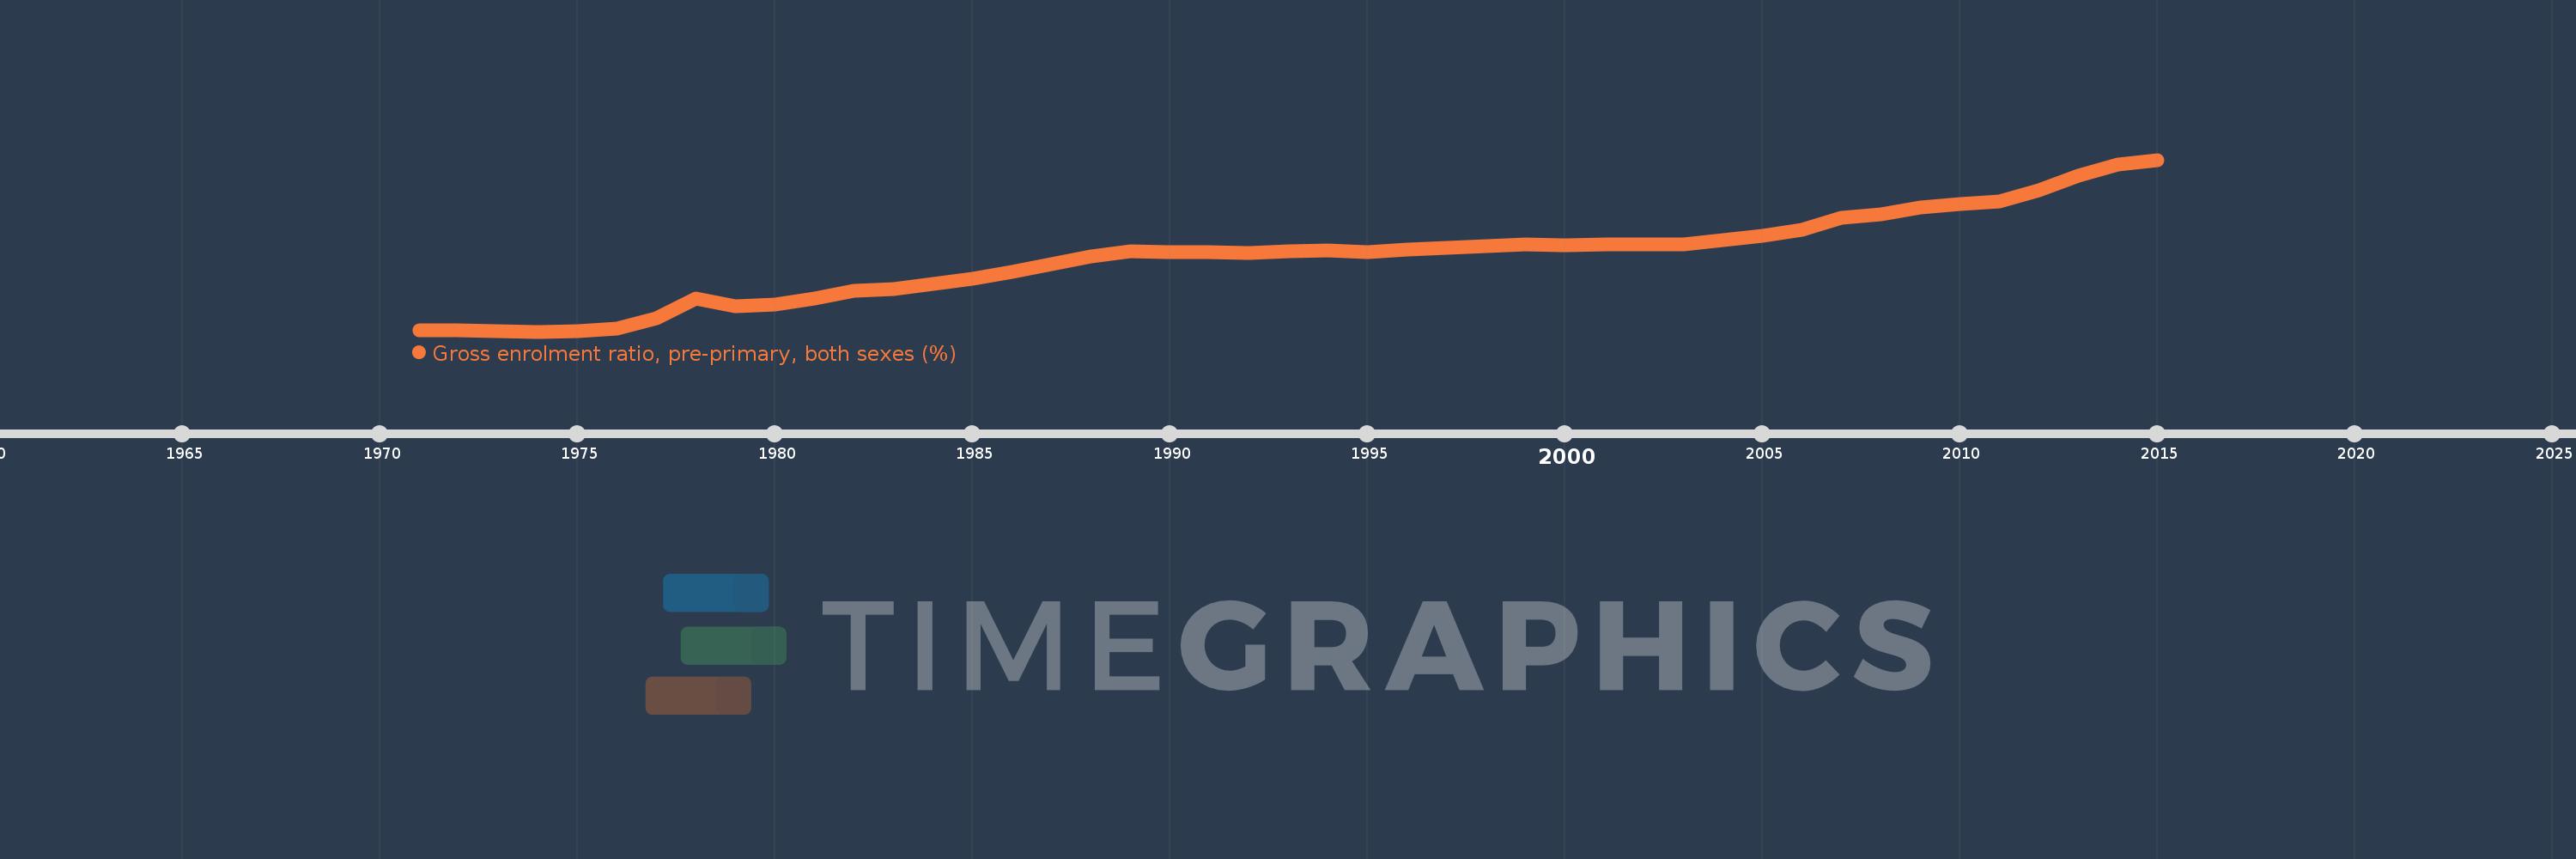
Gross enrolment ratio, pre-primary, both sexes (%)
2015,2014,2013,2012,2011,2010,2009,2008,2007,2006,2005,2004,2003,2002,2001,2000,1999,1998,1997,1996,1995,1994,1993,1992,1991,1990,1989,1988,1987,1986,1985,1984,1983,1982,1981,1980,1979,1978,1977,1976,1975,1974,1973,1972,1971
Estas estatísticas em outros países:
AfghanistanAlbaniaAlgeriaAndorraAngolaAntigua and BarbudaArab WorldArgentinaArmeniaArubaAustraliaAustriaAzerbaijanBahamas, TheBahrainBangladeshBarbadosBelarusBelgiumBelizeBeninBermudaBhutanBoliviaBosnia and HerzegovinaBotswanaBrazilBritish Virgin IslandsBrunei DarussalamBulgariaBurkina FasoBurundiCabo VerdeCambodiaCameroonCanadaCaribbean small statesCentral African RepublicCentral Europe and the BalticsChadChileChinaColombiaComorosCongo, Dem. Rep.Congo, Rep.Costa RicaCote d'IvoireCroatiaCubaCyprusCzech RepublicDenmarkDjiboutiDominicaDominican RepublicEarly-demographic dividendEast Asia & PacificEast Asia & Pacific (excluding high income)East Asia & Pacific (IDA & IBRD countries)EcuadorEgypt, Arab Rep.El SalvadorEquatorial GuineaEritreaEstoniaEthiopiaEuro areaEurope & Central AsiaEurope & Central Asia (excluding high income)Europe & Central Asia (IDA & IBRD countries)European UnionFijiFinlandFragile and conflict affected situationsFranceGabonGambia, TheGeorgiaGermanyGhanaGreeceGrenadaGuatemalaGuineaGuinea-BissauGuyanaHaitiHeavily indebted poor countries (HIPC)High incomeHondurasHong Kong SAR, ChinaHungaryIBRD onlyIcelandIDA & IBRD totalIDA blendIDA onlyIDA totalIndiaIndonesiaIran, Islamic Rep.IraqIrelandIsraelItalyJamaicaJapanJordanKazakhstanKenyaKiribatiKorea, Dem. People’s Rep.Korea, Rep.KuwaitKyrgyz RepublicLao PDRLate-demographic dividendLatin America & Caribbean Latin America & Caribbean (excluding high income)Latin America & the Caribbean (IDA & IBRD countries)LatviaLeast developed countries: UN classificationLebanonLesothoLiberiaLibyaLiechtensteinLithuaniaLow & middle incomeLow incomeLower middle incomeLuxembourgMacao SAR, ChinaMacedonia, FYRMadagascarMalaysiaMaldivesMaliMaltaMarshall IslandsMauritaniaMauritiusMexicoMicronesia, Fed. Sts.Middle East & North AfricaMiddle East & North Africa (excluding high income)Middle East & North Africa (IDA & IBRD countries)Middle incomeMoldovaMongoliaMontenegroMoroccoMozambiqueMyanmarNamibiaNauruNepalNetherlandsNew ZealandNicaraguaNigerNigeriaNorth AmericaNorwayOECD membersOmanOther small statesPacific island small statesPakistanPalauPanamaPapua New GuineaParaguayPeruPhilippinesPolandPortugalPost-demographic dividendPre-demographic dividendPuerto RicoQatarRomaniaRussian FederationRwandaSamoaSan MarinoSao Tome and PrincipeSaudi ArabiaSenegalSerbiaSeychellesSierra LeoneSlovak RepublicSloveniaSmall statesSolomon IslandsSomaliaSouth AfricaSouth AsiaSouth Asia (IDA & IBRD)South SudanSpainSri LankaSt. Kitts and NevisSt. LuciaSt. Vincent and the GrenadinesSub-Saharan Africa Sub-Saharan Africa (excluding high income)Sub-Saharan Africa (IDA & IBRD countries)SudanSurinameSwazilandSwedenSwitzerlandSyrian Arab RepublicTajikistanTanzaniaThailandTimor-LesteTogoTongaTrinidad and TobagoTunisiaTurkeyTurkmenistanTuvaluUgandaUkraineUnited Arab EmiratesUnited KingdomUnited StatesUpper middle incomeUruguayUzbekistanVanuatuVenezuela, RBVietnamWest Bank and GazaWorldYemen, Rep.ZambiaZimbabwe Linha do tempo:
Nesta escala de tempo está apresentado um gráfico de 1971 ano até 2015 ano Low & middle income. Dados de 1970 ano ausente. O número de observações reais por data: 45.
Fonte (nome):
Indicadores de desenvolvimento mundial
Fonte (organização):
UNESCO Institute for Statistics
Categorias:
Education
Foi atualizado:
23 abr 2017 ano
Indicadores de alterações dos valores ao longo dos anos
Mínimo:
9.735
1 jan 1974 ano
Máximo:
39.367
1 jan 2015 ano
Na data de observação
Valor
Mudança absoluta
A alteração em relação ao valor anterior
1 jan 1971 ano
10.03
+10.03
0.0%
1 jan 1972 ano
9.891
-0.139
-1.39%
1 jan 1973 ano
9.784
-0.107
-1.08%
1 jan 1974 ano
9.735
-0.05
-0.51%
1 jan 1975 ano
9.795
+0.06
0.62%
1 jan 1976 ano
10.263
+0.468
4.78%
1 jan 1977 ano
12.018
+1.755
17.1%
1 jan 1978 ano
15.497
+3.479
28.95%
1 jan 1979 ano
14.151
-1.346
-8.69%
1 jan 1980 ano
14.332
+0.182
1.28%
1 jan 1981 ano
15.374
+1.042
7.27%
1 jan 1982 ano
16.811
+1.437
9.35%
1 jan 1983 ano
17.132
+0.321
1.91%
1 jan 1984 ano
18.001
+0.869
5.07%
1 jan 1985 ano
18.857
+0.856
4.76%
1 jan 1986 ano
19.972
+1.115
5.92%
1 jan 1987 ano
21.348
+1.376
6.89%
1 jan 1988 ano
22.755
+1.407
6.59%
1 jan 1989 ano
23.571
+0.816
3.59%
1 jan 1990 ano
23.501
-0.069
-0.29%
1 jan 1991 ano
23.454
-0.047
-0.2%
1 jan 1992 ano
23.331
-0.123
-0.53%
1 jan 1993 ano
23.6
+0.269
1.15%
1 jan 1994 ano
23.685
+0.086
0.36%
1 jan 1995 ano
23.502
-0.183
-0.77%
1 jan 1996 ano
23.859
+0.357
1.52%
1 jan 1997 ano
24.179
+0.32
1.34%
1 jan 1998 ano
24.504
+0.325
1.34%
1 jan 1999 ano
24.766
+0.262
1.07%
1 jan 2000 ano
24.641
-0.125
-0.5%
1 jan 2001 ano
24.784
+0.142
0.58%
1 jan 2002 ano
24.761
-0.022
-0.09%
1 jan 2003 ano
24.764
+0.002
0.01%
1 jan 2004 ano
25.583
+0.819
3.31%
1 jan 2005 ano
26.312
+0.729
2.85%
1 jan 2006 ano
27.36
+1.048
3.98%
1 jan 2007 ano
29.314
+1.954
7.14%
1 jan 2008 ano
29.913
+0.599
2.04%
1 jan 2009 ano
31.199
+1.287
4.3%
1 jan 2010 ano
31.679
+0.479
1.54%
1 jan 2011 ano
32.111
+0.433
1.37%
1 jan 2012 ano
34.06
+1.949
6.07%
1 jan 2013 ano
36.597
+2.537
7.45%
1 jan 2014 ano
38.572
+1.975
5.4%
1 jan 2015 ano
39.367
+0.794
2.06%
Classificação de países por estatísticas atuais por anos


Comentários: