29
/pt/
pt
AIzaSyAYiBZKx7MnpbEhh9jyipgxe19OcubqV5w
April 1, 2024
24140
Arab World
ARB
false
2
1
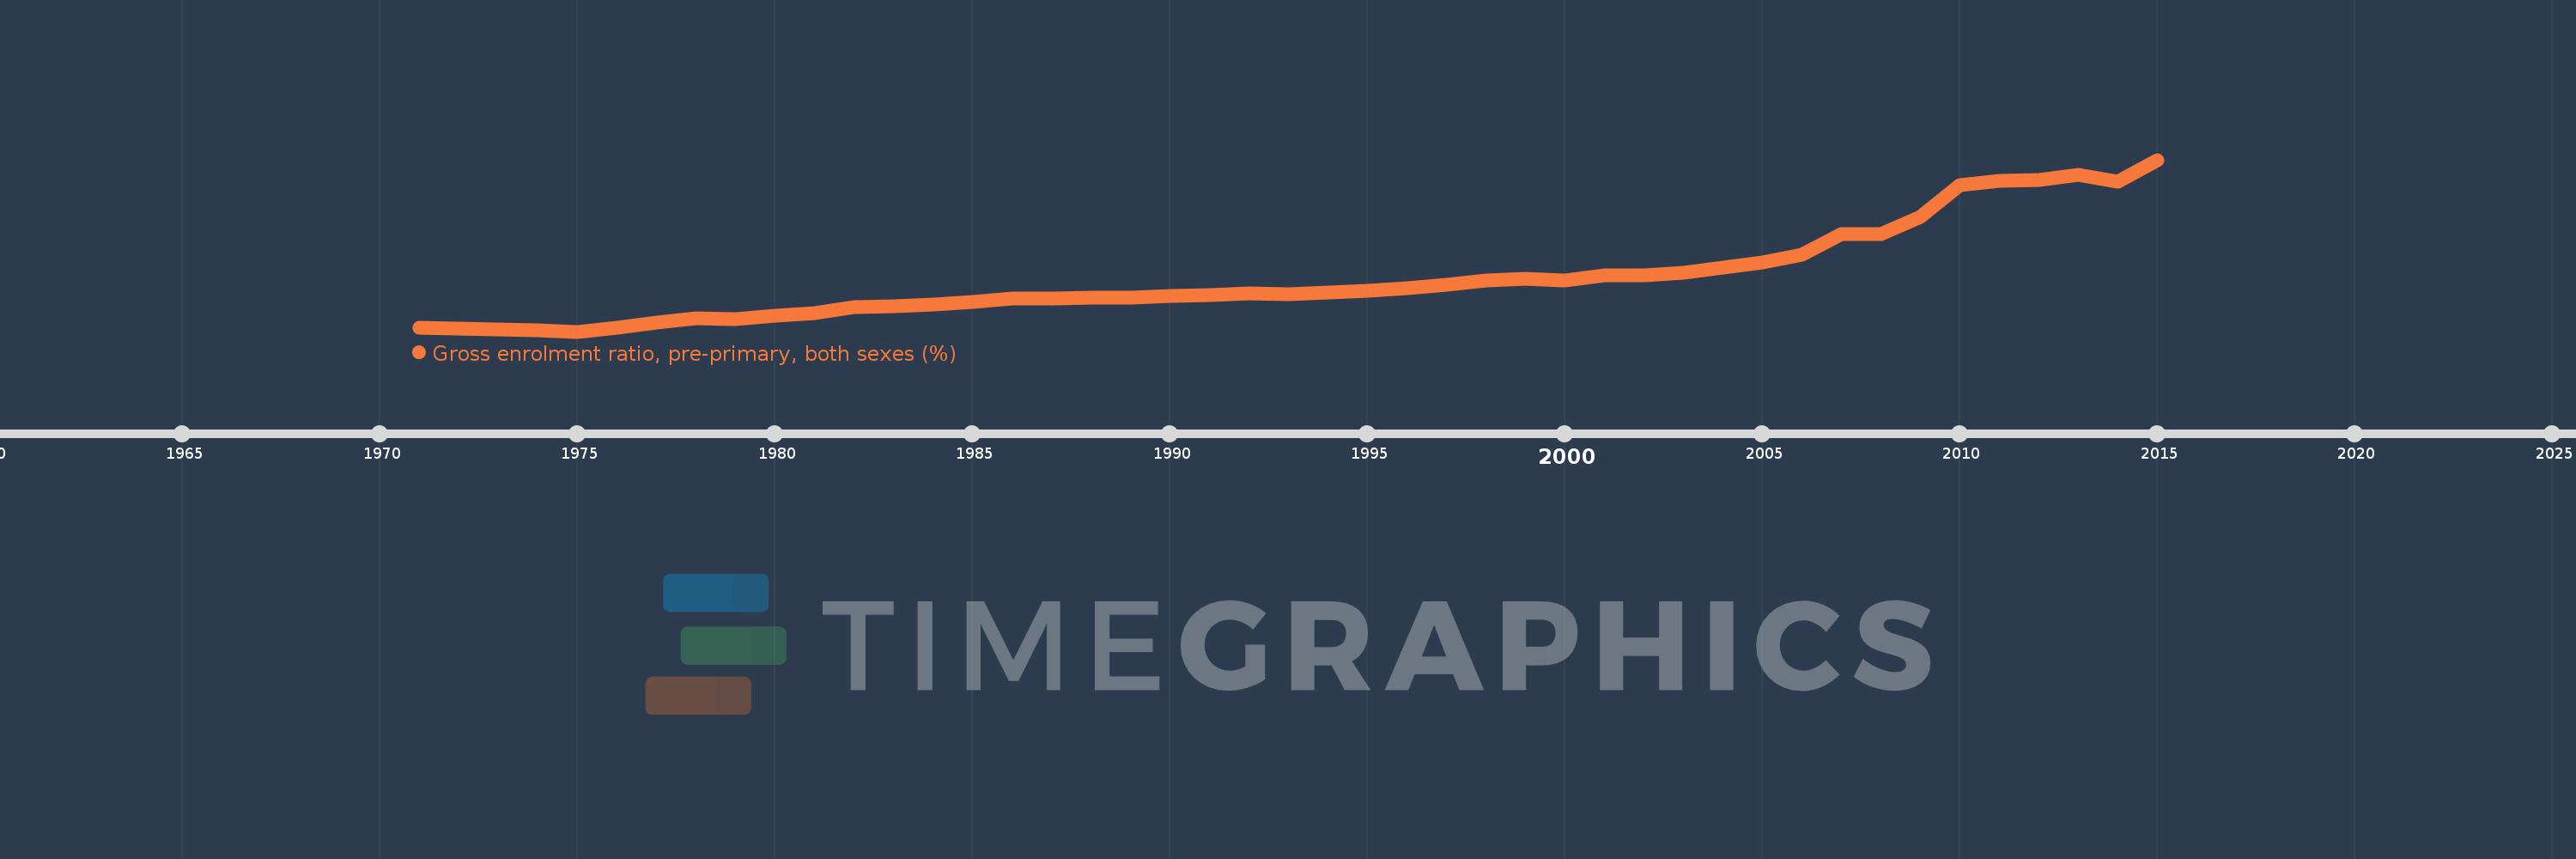
Gross enrolment ratio, pre-primary, both sexes (%)
2015,2014,2013,2012,2011,2010,2009,2008,2007,2006,2005,2004,2003,2002,2001,2000,1999,1998,1997,1996,1995,1994,1993,1992,1991,1990,1989,1988,1987,1986,1985,1984,1983,1982,1981,1980,1979,1978,1977,1976,1975,1974,1973,1972,1971
Estas estatísticas em outros países:
AfghanistanAlbaniaAlgeriaAndorraAngolaAntigua and BarbudaArab WorldArgentinaArmeniaArubaAustraliaAustriaAzerbaijanBahamas, TheBahrainBangladeshBarbadosBelarusBelgiumBelizeBeninBermudaBhutanBoliviaBosnia and HerzegovinaBotswanaBrazilBritish Virgin IslandsBrunei DarussalamBulgariaBurkina FasoBurundiCabo VerdeCambodiaCameroonCanadaCaribbean small statesCentral African RepublicCentral Europe and the BalticsChadChileChinaColombiaComorosCongo, Dem. Rep.Congo, Rep.Costa RicaCote d'IvoireCroatiaCubaCyprusCzech RepublicDenmarkDjiboutiDominicaDominican RepublicEarly-demographic dividendEast Asia & PacificEast Asia & Pacific (excluding high income)East Asia & Pacific (IDA & IBRD countries)EcuadorEgypt, Arab Rep.El SalvadorEquatorial GuineaEritreaEstoniaEthiopiaEuro areaEurope & Central AsiaEurope & Central Asia (excluding high income)Europe & Central Asia (IDA & IBRD countries)European UnionFijiFinlandFragile and conflict affected situationsFranceGabonGambia, TheGeorgiaGermanyGhanaGreeceGrenadaGuatemalaGuineaGuinea-BissauGuyanaHaitiHeavily indebted poor countries (HIPC)High incomeHondurasHong Kong SAR, ChinaHungaryIBRD onlyIcelandIDA & IBRD totalIDA blendIDA onlyIDA totalIndiaIndonesiaIran, Islamic Rep.IraqIrelandIsraelItalyJamaicaJapanJordanKazakhstanKenyaKiribatiKorea, Dem. People’s Rep.Korea, Rep.KuwaitKyrgyz RepublicLao PDRLate-demographic dividendLatin America & Caribbean Latin America & Caribbean (excluding high income)Latin America & the Caribbean (IDA & IBRD countries)LatviaLeast developed countries: UN classificationLebanonLesothoLiberiaLibyaLiechtensteinLithuaniaLow & middle incomeLow incomeLower middle incomeLuxembourgMacao SAR, ChinaMacedonia, FYRMadagascarMalaysiaMaldivesMaliMaltaMarshall IslandsMauritaniaMauritiusMexicoMicronesia, Fed. Sts.Middle East & North AfricaMiddle East & North Africa (excluding high income)Middle East & North Africa (IDA & IBRD countries)Middle incomeMoldovaMongoliaMontenegroMoroccoMozambiqueMyanmarNamibiaNauruNepalNetherlandsNew ZealandNicaraguaNigerNigeriaNorth AmericaNorwayOECD membersOmanOther small statesPacific island small statesPakistanPalauPanamaPapua New GuineaParaguayPeruPhilippinesPolandPortugalPost-demographic dividendPre-demographic dividendPuerto RicoQatarRomaniaRussian FederationRwandaSamoaSan MarinoSao Tome and PrincipeSaudi ArabiaSenegalSerbiaSeychellesSierra LeoneSlovak RepublicSloveniaSmall statesSolomon IslandsSomaliaSouth AfricaSouth AsiaSouth Asia (IDA & IBRD)South SudanSpainSri LankaSt. Kitts and NevisSt. LuciaSt. Vincent and the GrenadinesSub-Saharan Africa Sub-Saharan Africa (excluding high income)Sub-Saharan Africa (IDA & IBRD countries)SudanSurinameSwazilandSwedenSwitzerlandSyrian Arab RepublicTajikistanTanzaniaThailandTimor-LesteTogoTongaTrinidad and TobagoTunisiaTurkeyTurkmenistanTuvaluUgandaUkraineUnited Arab EmiratesUnited KingdomUnited StatesUpper middle incomeUruguayUzbekistanVanuatuVenezuela, RBVietnamWest Bank and GazaWorldYemen, Rep.ZambiaZimbabwe Linha do tempo:
Nesta escala de tempo está apresentado um gráfico de 1971 ano até 2015 ano Arab World. Dados de 1970 ano ausente. O número de observações reais por data: 45.
Fonte (nome):
Indicadores de desenvolvimento mundial
Fonte (organização):
UNESCO Institute for Statistics
Categorias:
Education
Foi atualizado:
23 abr 2017 ano
Indicadores de alterações dos valores ao longo dos anos
Mínimo:
9.366
1 jan 1975 ano
Máximo:
25.502
1 jan 2015 ano
Na data de observação
Valor
Mudança absoluta
A alteração em relação ao valor anterior
1 jan 1971 ano
9.717
+9.717
0.0%
1 jan 1972 ano
9.647
-0.07
-0.72%
1 jan 1973 ano
9.553
-0.094
-0.97%
1 jan 1974 ano
9.501
-0.052
-0.55%
1 jan 1975 ano
9.366
-0.135
-1.42%
1 jan 1976 ano
9.693
+0.327
3.49%
1 jan 1977 ano
10.219
+0.527
5.43%
1 jan 1978 ano
10.597
+0.378
3.69%
1 jan 1979 ano
10.547
-0.05
-0.47%
1 jan 1980 ano
10.872
+0.325
3.08%
1 jan 1981 ano
11.132
+0.26
2.39%
1 jan 1982 ano
11.637
+0.505
4.54%
1 jan 1983 ano
11.726
+0.09
0.77%
1 jan 1984 ano
11.882
+0.156
1.33%
1 jan 1985 ano
12.117
+0.234
1.97%
1 jan 1986 ano
12.478
+0.362
2.99%
1 jan 1987 ano
12.46
-0.019
-0.15%
1 jan 1988 ano
12.531
+0.071
0.57%
1 jan 1989 ano
12.526
-0.005
-0.04%
1 jan 1990 ano
12.746
+0.22
1.75%
1 jan 1991 ano
12.822
+0.076
0.6%
1 jan 1992 ano
12.923
+0.102
0.79%
1 jan 1993 ano
12.852
-0.072
-0.56%
1 jan 1994 ano
13.033
+0.181
1.41%
1 jan 1995 ano
13.236
+0.203
1.56%
1 jan 1996 ano
13.407
+0.171
1.29%
1 jan 1997 ano
13.734
+0.327
2.44%
1 jan 1998 ano
14.193
+0.46
3.35%
1 jan 1999 ano
14.308
+0.115
0.81%
1 jan 2000 ano
14.146
-0.162
-1.13%
1 jan 2001 ano
14.623
+0.478
3.38%
1 jan 2002 ano
14.611
-0.012
-0.08%
1 jan 2003 ano
14.897
+0.286
1.95%
1 jan 2004 ano
15.356
+0.46
3.09%
1 jan 2005 ano
15.872
+0.515
3.35%
1 jan 2006 ano
16.611
+0.74
4.66%
1 jan 2007 ano
18.558
+1.947
11.72%
1 jan 2008 ano
18.523
-0.035
-0.19%
1 jan 2009 ano
20.118
+1.594
8.61%
1 jan 2010 ano
23.098
+2.98
14.81%
1 jan 2011 ano
23.558
+0.461
1.99%
1 jan 2012 ano
23.614
+0.056
0.24%
1 jan 2013 ano
24.056
+0.441
1.87%
1 jan 2014 ano
23.465
-0.591
-2.46%
1 jan 2015 ano
25.502
+2.037
8.68%
Classificação de países por estatísticas atuais por anos


Comentários: