29
/pt/
pt
AIzaSyAYiBZKx7MnpbEhh9jyipgxe19OcubqV5w
April 1, 2024
195604
Mexico
MEX
true
2
1
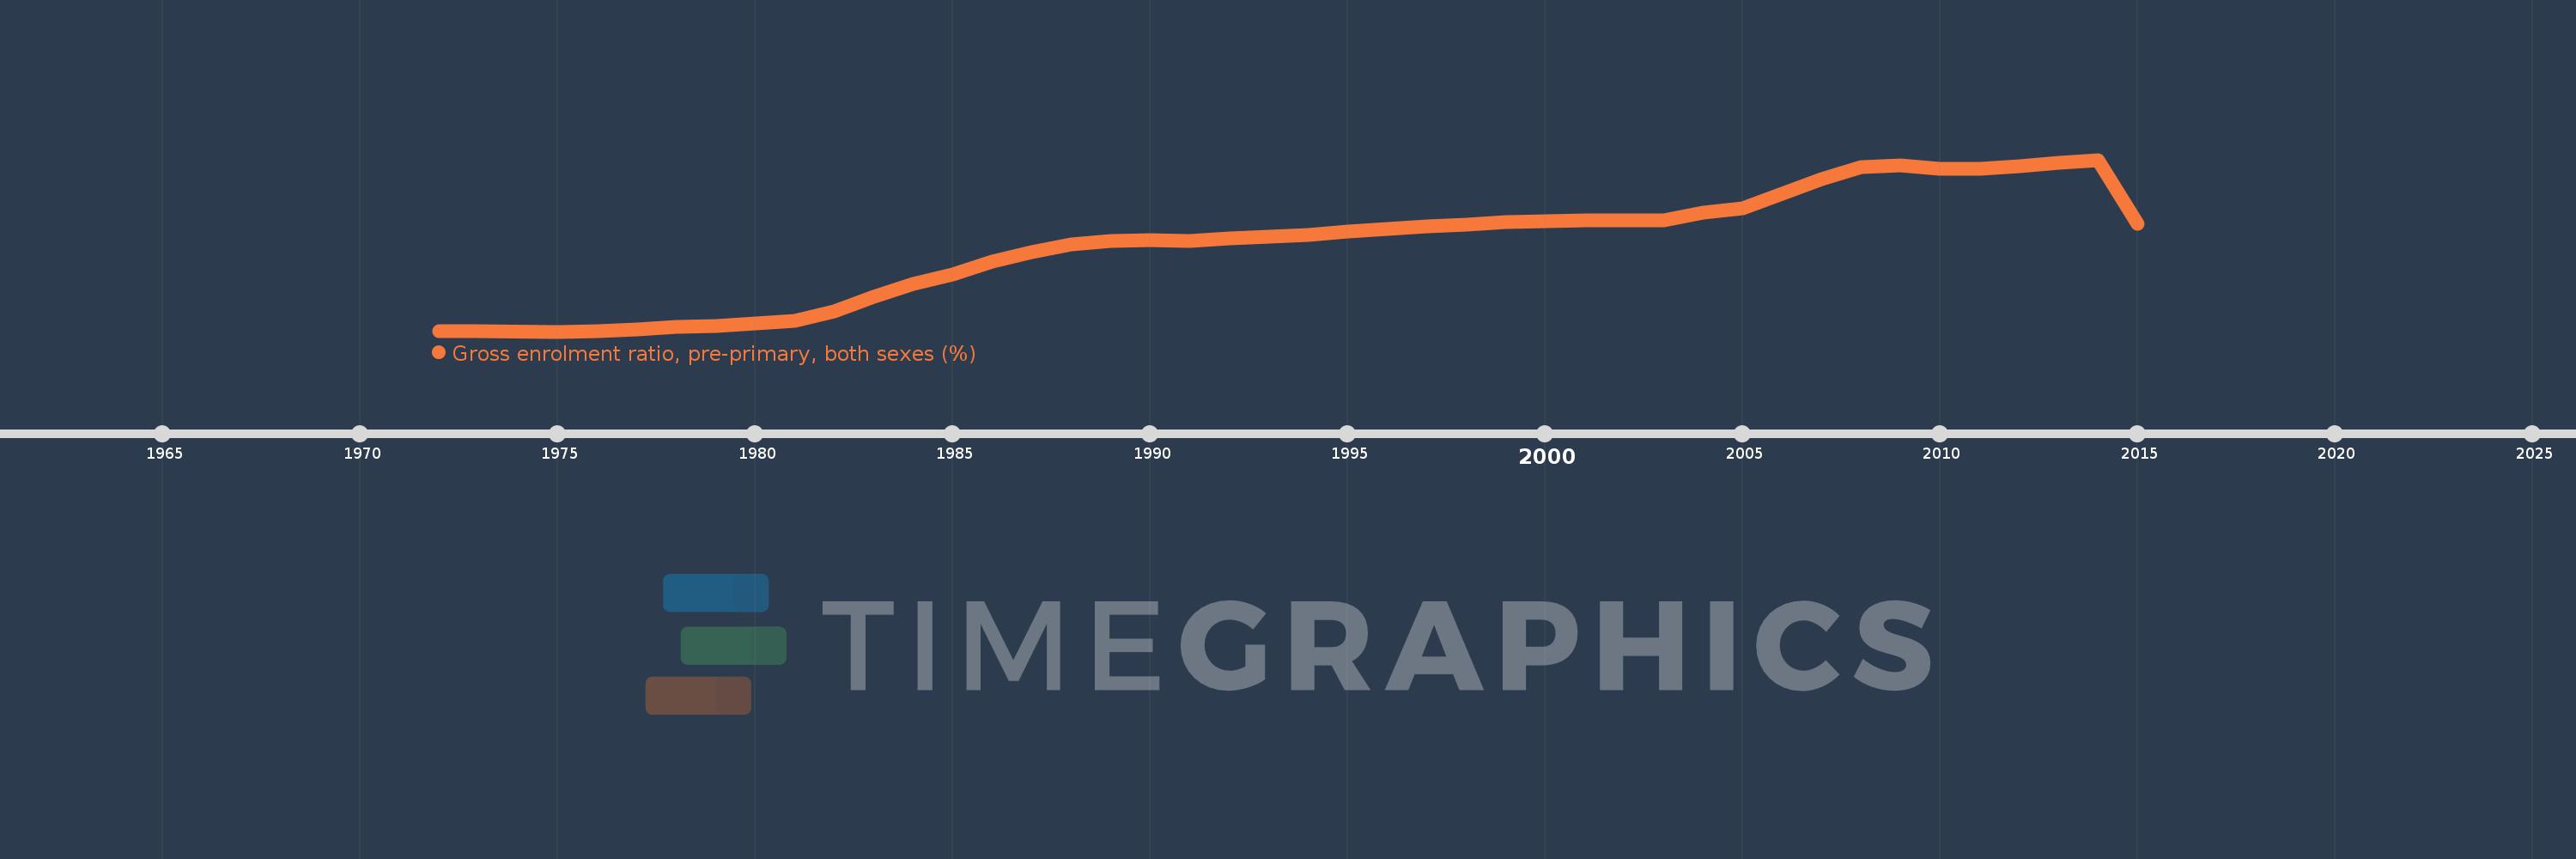
Gross enrolment ratio, pre-primary, both sexes (%)
2015,2014,2013,2012,2011,2010,2009,2008,2007,2006,2005,2004,2003,2002,2001,2000,1999,1998,1997,1996,1995,1994,1993,1992,1991,1990,1989,1988,1987,1986,1985,1984,1983,1982,1981,1979,1978,1977,1976,1975,1973,1972
Estas estatísticas em outros países:
AfghanistanAlbaniaAlgeriaAndorraAngolaAntigua and BarbudaArab WorldArgentinaArmeniaArubaAustraliaAustriaAzerbaijanBahamas, TheBahrainBangladeshBarbadosBelarusBelgiumBelizeBeninBermudaBhutanBoliviaBosnia and HerzegovinaBotswanaBrazilBritish Virgin IslandsBrunei DarussalamBulgariaBurkina FasoBurundiCabo VerdeCambodiaCameroonCanadaCaribbean small statesCentral African RepublicCentral Europe and the BalticsChadChileChinaColombiaComorosCongo, Dem. Rep.Congo, Rep.Costa RicaCote d'IvoireCroatiaCubaCyprusCzech RepublicDenmarkDjiboutiDominicaDominican RepublicEarly-demographic dividendEast Asia & PacificEast Asia & Pacific (excluding high income)East Asia & Pacific (IDA & IBRD countries)EcuadorEgypt, Arab Rep.El SalvadorEquatorial GuineaEritreaEstoniaEthiopiaEuro areaEurope & Central AsiaEurope & Central Asia (excluding high income)Europe & Central Asia (IDA & IBRD countries)European UnionFijiFinlandFragile and conflict affected situationsFranceGabonGambia, TheGeorgiaGermanyGhanaGreeceGrenadaGuatemalaGuineaGuinea-BissauGuyanaHaitiHeavily indebted poor countries (HIPC)High incomeHondurasHong Kong SAR, ChinaHungaryIBRD onlyIcelandIDA & IBRD totalIDA blendIDA onlyIDA totalIndiaIndonesiaIran, Islamic Rep.IraqIrelandIsraelItalyJamaicaJapanJordanKazakhstanKenyaKiribatiKorea, Dem. People’s Rep.Korea, Rep.KuwaitKyrgyz RepublicLao PDRLate-demographic dividendLatin America & Caribbean Latin America & Caribbean (excluding high income)Latin America & the Caribbean (IDA & IBRD countries)LatviaLeast developed countries: UN classificationLebanonLesothoLiberiaLibyaLiechtensteinLithuaniaLow & middle incomeLow incomeLower middle incomeLuxembourgMacao SAR, ChinaMacedonia, FYRMadagascarMalaysiaMaldivesMaliMaltaMarshall IslandsMauritaniaMauritiusMexicoMicronesia, Fed. Sts.Middle East & North AfricaMiddle East & North Africa (excluding high income)Middle East & North Africa (IDA & IBRD countries)Middle incomeMoldovaMongoliaMontenegroMoroccoMozambiqueMyanmarNamibiaNauruNepalNetherlandsNew ZealandNicaraguaNigerNigeriaNorth AmericaNorwayOECD membersOmanOther small statesPacific island small statesPakistanPalauPanamaPapua New GuineaParaguayPeruPhilippinesPolandPortugalPost-demographic dividendPre-demographic dividendPuerto RicoQatarRomaniaRussian FederationRwandaSamoaSan MarinoSao Tome and PrincipeSaudi ArabiaSenegalSerbiaSeychellesSierra LeoneSlovak RepublicSloveniaSmall statesSolomon IslandsSomaliaSouth AfricaSouth AsiaSouth Asia (IDA & IBRD)South SudanSpainSri LankaSt. Kitts and NevisSt. LuciaSt. Vincent and the GrenadinesSub-Saharan Africa Sub-Saharan Africa (excluding high income)Sub-Saharan Africa (IDA & IBRD countries)SudanSurinameSwazilandSwedenSwitzerlandSyrian Arab RepublicTajikistanTanzaniaThailandTimor-LesteTogoTongaTrinidad and TobagoTunisiaTurkeyTurkmenistanTuvaluUgandaUkraineUnited Arab EmiratesUnited KingdomUnited StatesUpper middle incomeUruguayUzbekistanVanuatuVenezuela, RBVietnamWest Bank and GazaWorldYemen, Rep.ZambiaZimbabwe Linha do tempo:
Nesta escala de tempo está apresentado um gráfico de 1972 ano até 2015 ano Mexico. Dados de 1971 ano ausente. O número de observações reais por data: 42.
Fonte (nome):
Indicadores de desenvolvimento mundial
Fonte (organização):
UNESCO Institute for Statistics
Categorias:
Education
Foi atualizado:
23 abr 2017 ano
Indicadores de alterações dos valores ao longo dos anos
Mínimo:
12.189
1 jan 1975 ano
Máximo:
102.423
1 jan 2014 ano
Na data de observação
Valor
Mudança absoluta
A alteração em relação ao valor anterior
1 jan 1972 ano
12.263
+12.263
0.0%
1 jan 1973 ano
12.424
+0.161
1.31%
1 jan 1975 ano
12.189
-0.235
-1.89%
1 jan 1976 ano
12.502
+0.313
2.57%
1 jan 1977 ano
13.245
+0.743
5.94%
1 jan 1978 ano
14.884
+1.639
12.37%
1 jan 1979 ano
15.001
+0.117
0.79%
1 jan 1981 ano
17.972
+2.971
19.81%
1 jan 1982 ano
22.989
+5.017
27.91%
1 jan 1983 ano
30.446
+7.457
32.44%
1 jan 1984 ano
37.084
+6.638
21.8%
1 jan 1985 ano
42.393
+5.309
14.32%
1 jan 1986 ano
48.804
+6.411
15.12%
1 jan 1987 ano
54.008
+5.204
10.66%
1 jan 1988 ano
57.895
+3.887
7.2%
1 jan 1989 ano
59.592
+1.697
2.93%
1 jan 1990 ano
60.325
+0.733
1.23%
1 jan 1991 ano
59.902
-0.423
-0.7%
1 jan 1992 ano
61.304
+1.402
2.34%
1 jan 1993 ano
62.01
+0.706
1.15%
1 jan 1994 ano
62.742
+0.733
1.18%
1 jan 1995 ano
64.578
+1.836
2.93%
1 jan 1996 ano
66.317
+1.739
2.69%
1 jan 1997 ano
67.593
+1.276
1.92%
1 jan 1998 ano
68.52
+0.926
1.37%
1 jan 1999 ano
69.603
+1.083
1.58%
1 jan 2000 ano
70.201
+0.598
0.86%
1 jan 2001 ano
70.535
+0.334
0.48%
1 jan 2002 ano
70.838
+0.303
0.43%
1 jan 2003 ano
70.795
-0.043
-0.06%
1 jan 2004 ano
74.866
+4.071
5.75%
1 jan 2005 ano
77.029
+2.163
2.89%
1 jan 2006 ano
84.396
+7.367
9.56%
1 jan 2007 ano
92.048
+7.652
9.07%
1 jan 2008 ano
98.542
+6.494
7.06%
1 jan 2009 ano
99.373
+0.831
0.84%
1 jan 2010 ano
97.764
-1.609
-1.62%
1 jan 2011 ano
97.859
+0.094
0.1%
1 jan 2012 ano
98.974
+1.116
1.14%
1 jan 2013 ano
100.791
+1.817
1.84%
1 jan 2014 ano
102.423
+1.633
1.62%
1 jan 2015 ano
68.958
-33.465
-32.67%
Classificação de países por estatísticas atuais por anos


Comentários: