29
/pt/
pt
AIzaSyAYiBZKx7MnpbEhh9jyipgxe19OcubqV5w
April 1, 2024
41490
Latin America & Caribbean
LCN
false
2
1
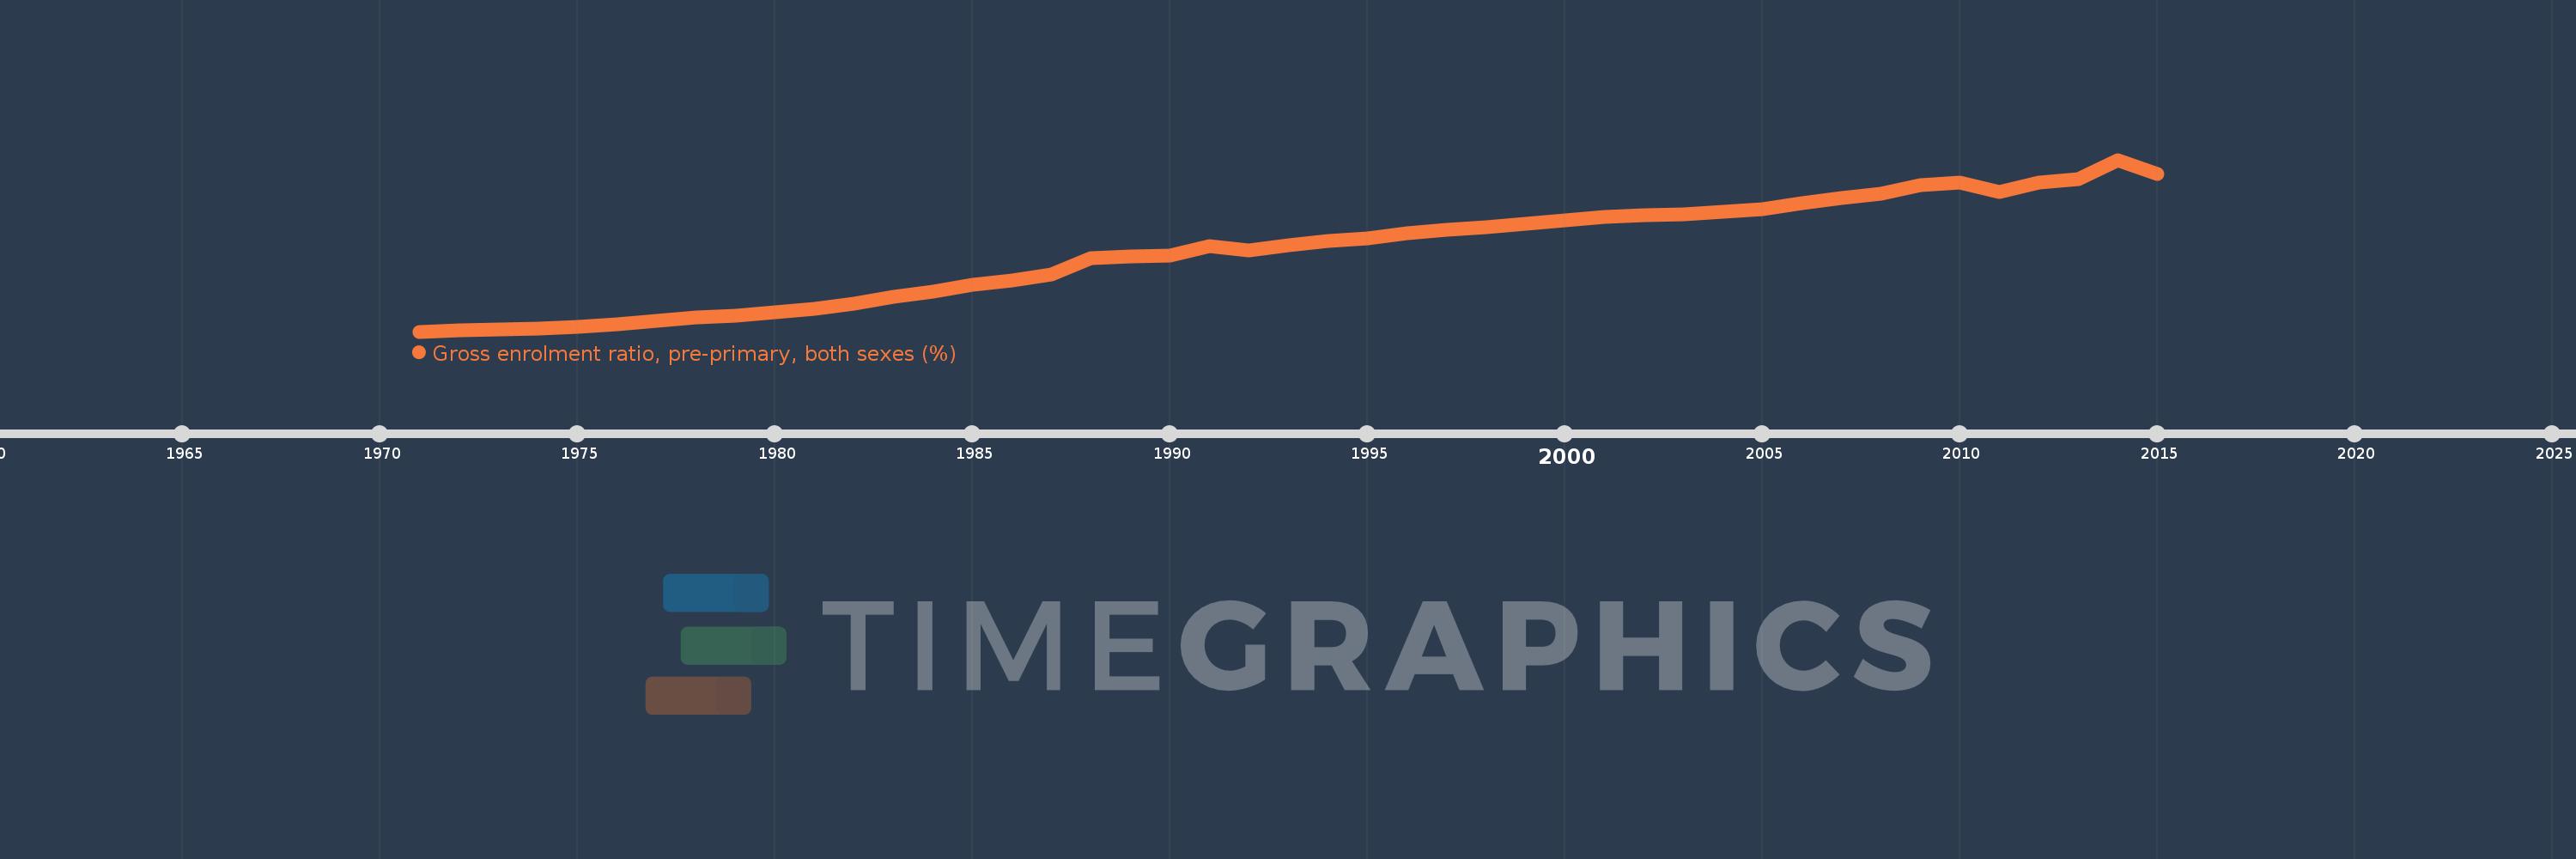
Gross enrolment ratio, pre-primary, both sexes (%)
2015,2014,2013,2012,2011,2010,2009,2008,2007,2006,2005,2004,2003,2002,2001,2000,1999,1998,1997,1996,1995,1994,1993,1992,1991,1990,1989,1988,1987,1986,1985,1984,1983,1982,1981,1980,1979,1978,1977,1976,1975,1974,1973,1972,1971
Estas estatísticas em outros países:
AfghanistanAlbaniaAlgeriaAndorraAngolaAntigua and BarbudaArab WorldArgentinaArmeniaArubaAustraliaAustriaAzerbaijanBahamas, TheBahrainBangladeshBarbadosBelarusBelgiumBelizeBeninBermudaBhutanBoliviaBosnia and HerzegovinaBotswanaBrazilBritish Virgin IslandsBrunei DarussalamBulgariaBurkina FasoBurundiCabo VerdeCambodiaCameroonCanadaCaribbean small statesCentral African RepublicCentral Europe and the BalticsChadChileChinaColombiaComorosCongo, Dem. Rep.Congo, Rep.Costa RicaCote d'IvoireCroatiaCubaCyprusCzech RepublicDenmarkDjiboutiDominicaDominican RepublicEarly-demographic dividendEast Asia & PacificEast Asia & Pacific (excluding high income)East Asia & Pacific (IDA & IBRD countries)EcuadorEgypt, Arab Rep.El SalvadorEquatorial GuineaEritreaEstoniaEthiopiaEuro areaEurope & Central AsiaEurope & Central Asia (excluding high income)Europe & Central Asia (IDA & IBRD countries)European UnionFijiFinlandFragile and conflict affected situationsFranceGabonGambia, TheGeorgiaGermanyGhanaGreeceGrenadaGuatemalaGuineaGuinea-BissauGuyanaHaitiHeavily indebted poor countries (HIPC)High incomeHondurasHong Kong SAR, ChinaHungaryIBRD onlyIcelandIDA & IBRD totalIDA blendIDA onlyIDA totalIndiaIndonesiaIran, Islamic Rep.IraqIrelandIsraelItalyJamaicaJapanJordanKazakhstanKenyaKiribatiKorea, Dem. People’s Rep.Korea, Rep.KuwaitKyrgyz RepublicLao PDRLate-demographic dividendLatin America & Caribbean Latin America & Caribbean (excluding high income)Latin America & the Caribbean (IDA & IBRD countries)LatviaLeast developed countries: UN classificationLebanonLesothoLiberiaLibyaLiechtensteinLithuaniaLow & middle incomeLow incomeLower middle incomeLuxembourgMacao SAR, ChinaMacedonia, FYRMadagascarMalaysiaMaldivesMaliMaltaMarshall IslandsMauritaniaMauritiusMexicoMicronesia, Fed. Sts.Middle East & North AfricaMiddle East & North Africa (excluding high income)Middle East & North Africa (IDA & IBRD countries)Middle incomeMoldovaMongoliaMontenegroMoroccoMozambiqueMyanmarNamibiaNauruNepalNetherlandsNew ZealandNicaraguaNigerNigeriaNorth AmericaNorwayOECD membersOmanOther small statesPacific island small statesPakistanPalauPanamaPapua New GuineaParaguayPeruPhilippinesPolandPortugalPost-demographic dividendPre-demographic dividendPuerto RicoQatarRomaniaRussian FederationRwandaSamoaSan MarinoSao Tome and PrincipeSaudi ArabiaSenegalSerbiaSeychellesSierra LeoneSlovak RepublicSloveniaSmall statesSolomon IslandsSomaliaSouth AfricaSouth AsiaSouth Asia (IDA & IBRD)South SudanSpainSri LankaSt. Kitts and NevisSt. LuciaSt. Vincent and the GrenadinesSub-Saharan Africa Sub-Saharan Africa (excluding high income)Sub-Saharan Africa (IDA & IBRD countries)SudanSurinameSwazilandSwedenSwitzerlandSyrian Arab RepublicTajikistanTanzaniaThailandTimor-LesteTogoTongaTrinidad and TobagoTunisiaTurkeyTurkmenistanTuvaluUgandaUkraineUnited Arab EmiratesUnited KingdomUnited StatesUpper middle incomeUruguayUzbekistanVanuatuVenezuela, RBVietnamWest Bank and GazaWorldYemen, Rep.ZambiaZimbabwe Linha do tempo:
Nesta escala de tempo está apresentado um gráfico de 1971 ano até 2015 ano Latin America & Caribbean . Dados de 1970 ano ausente. O número de observações reais por data: 45.
Fonte (nome):
Indicadores de desenvolvimento mundial
Fonte (organização):
UNESCO Institute for Statistics
Categorias:
Education
Foi atualizado:
23 abr 2017 ano
Indicadores de alterações dos valores ao longo dos anos
Mínimo:
8.401
1 jan 1971 ano
Máximo:
78.969
1 jan 2014 ano
Na data de observação
Valor
Mudança absoluta
A alteração em relação ao valor anterior
1 jan 1971 ano
8.401
+8.401
0.0%
1 jan 1972 ano
8.785
+0.383
4.56%
1 jan 1973 ano
9.246
+0.462
5.25%
1 jan 1974 ano
9.687
+0.441
4.77%
1 jan 1975 ano
10.276
+0.589
6.08%
1 jan 1976 ano
11.329
+1.053
10.25%
1 jan 1977 ano
12.812
+1.482
13.08%
1 jan 1978 ano
14.084
+1.272
9.93%
1 jan 1979 ano
15.086
+1.002
7.11%
1 jan 1980 ano
16.506
+1.42
9.41%
1 jan 1981 ano
17.596
+1.09
6.6%
1 jan 1982 ano
19.844
+2.248
12.78%
1 jan 1983 ano
22.649
+2.805
14.14%
1 jan 1984 ano
24.858
+2.209
9.75%
1 jan 1985 ano
27.484
+2.626
10.56%
1 jan 1986 ano
29.343
+1.859
6.77%
1 jan 1987 ano
31.734
+2.391
8.15%
1 jan 1988 ano
38.593
+6.859
21.62%
1 jan 1989 ano
39.145
+0.551
1.43%
1 jan 1990 ano
39.61
+0.465
1.19%
1 jan 1991 ano
43.403
+3.793
9.58%
1 jan 1992 ano
41.72
-1.683
-3.88%
1 jan 1993 ano
43.974
+2.254
5.4%
1 jan 1994 ano
45.755
+1.781
4.05%
1 jan 1995 ano
46.685
+0.929
2.03%
1 jan 1996 ano
48.667
+1.983
4.25%
1 jan 1997 ano
50.335
+1.668
3.43%
1 jan 1998 ano
51.356
+1.021
2.03%
1 jan 1999 ano
52.702
+1.346
2.62%
1 jan 2000 ano
54.142
+1.44
2.73%
1 jan 2001 ano
55.484
+1.342
2.48%
1 jan 2002 ano
56.303
+0.819
1.48%
1 jan 2003 ano
56.705
+0.402
0.71%
1 jan 2004 ano
57.678
+0.972
1.71%
1 jan 2005 ano
58.799
+1.121
1.94%
1 jan 2006 ano
61.004
+2.205
3.75%
1 jan 2007 ano
63.173
+2.169
3.56%
1 jan 2008 ano
64.864
+1.692
2.68%
1 jan 2009 ano
68.447
+3.583
5.52%
1 jan 2010 ano
69.545
+1.098
1.6%
1 jan 2011 ano
65.632
-3.913
-5.63%
1 jan 2012 ano
69.673
+4.04
6.16%
1 jan 2013 ano
71.101
+1.428
2.05%
1 jan 2014 ano
78.969
+7.868
11.07%
1 jan 2015 ano
72.986
-5.982
-7.58%
Classificação de países por estatísticas atuais por anos


Comentários: