29
/pt/
pt
AIzaSyAYiBZKx7MnpbEhh9jyipgxe19OcubqV5w
April 1, 2024
44621
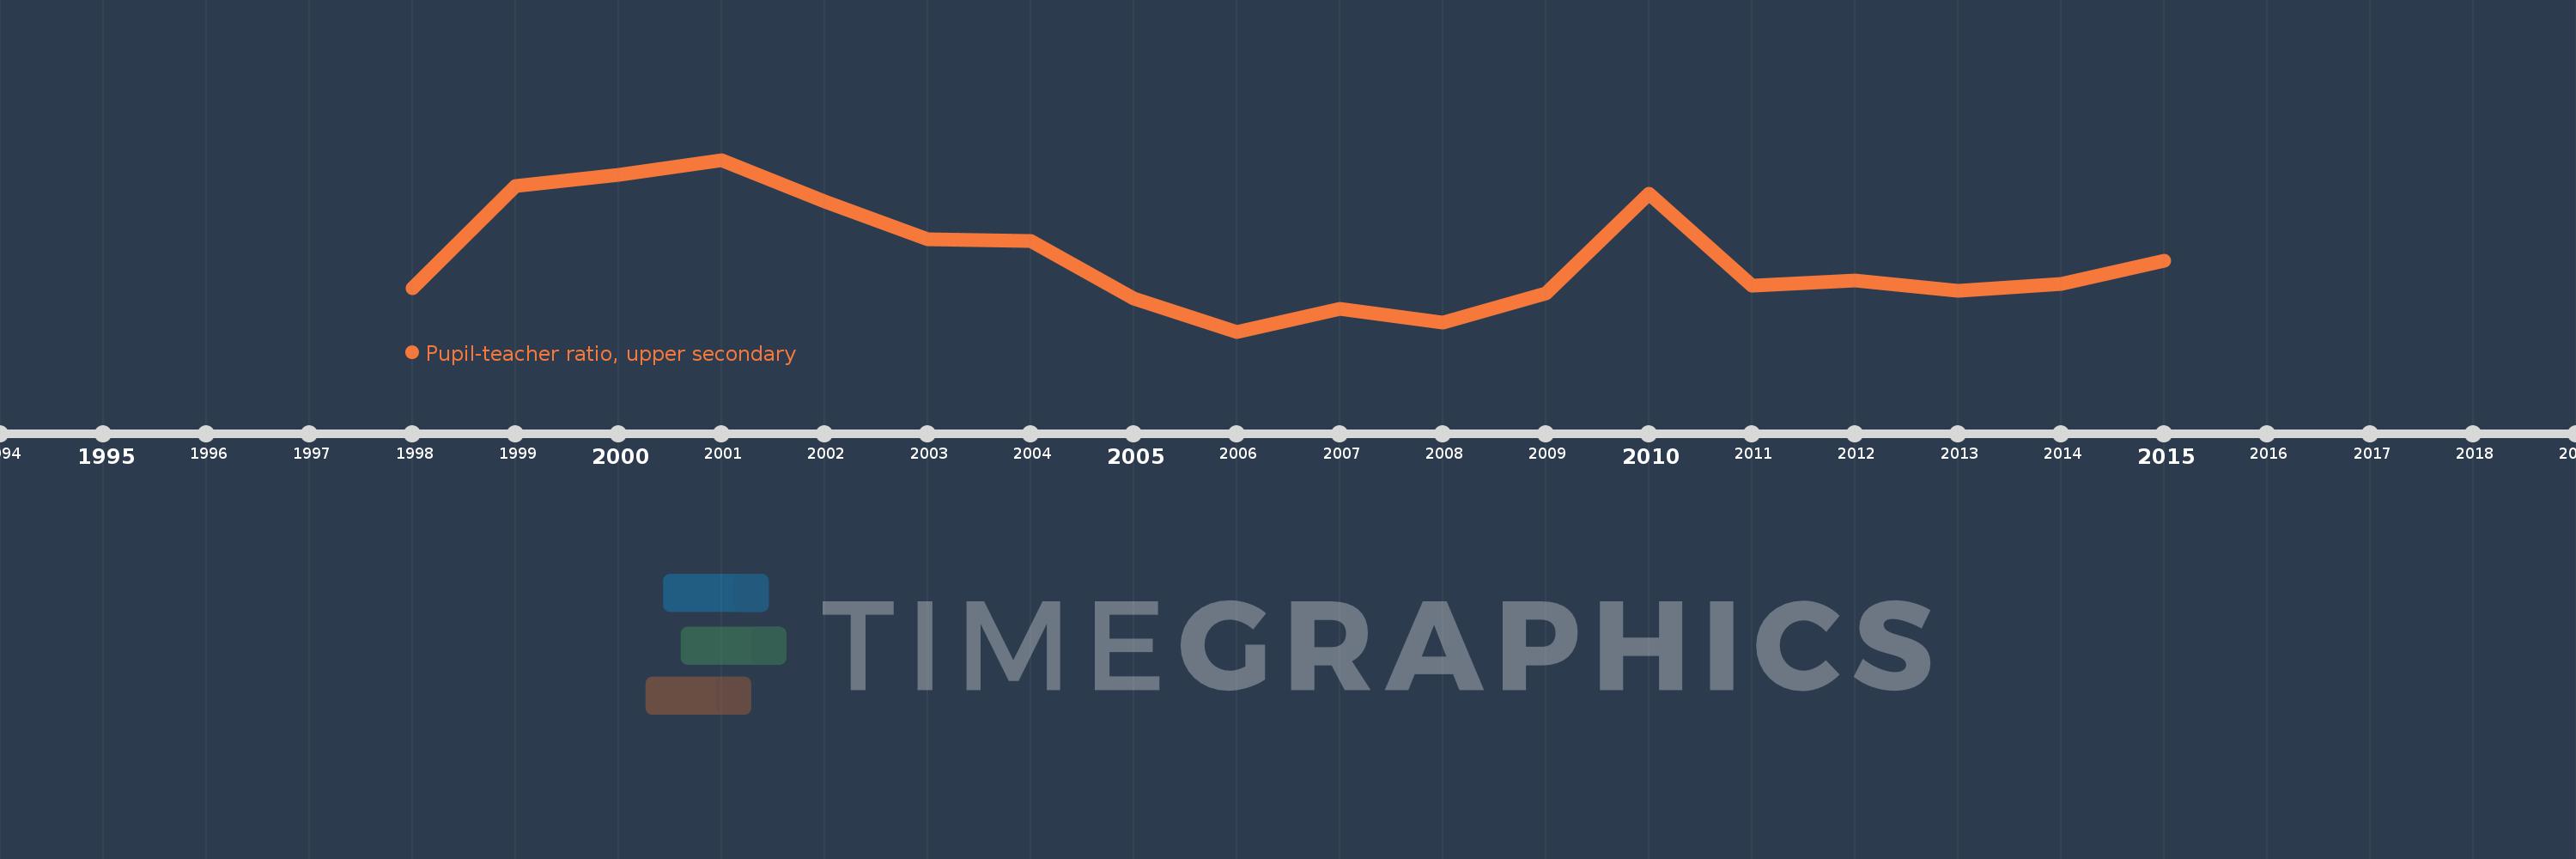
Least developed countries: UN classification
LDC
false
2
1
Pupil-teacher ratio, upper secondary
2015,2014,2013,2012,2011,2010,2009,2008,2007,2006,2005,2004,2003,2002,2001,2000,1999,1998
Estas estatísticas em outros países:
Linha do tempo:
Nesta escala de tempo está apresentado um gráfico de 1998 ano até 2015 ano Least developed countries: UN classification. Dados de 1997 ano ausente. O número de observações reais por data: 18.
Fonte (nome):
Indicadores de desenvolvimento mundial
Fonte (organização):
United Nations Educational, Scientific, and Cultural Organization (UNESCO) Institute for Statistics.
Categorias:
Education
Foi atualizado:
23 abr 2017 ano
Indicadores de alterações dos valores ao longo dos anos
Mínimo:
20.434
1 jan 2006 ano
Máximo:
26.143
1 jan 2001 ano
Na data de observação
Valor
Mudança absoluta
A alteração em relação ao valor anterior
1 jan 1998 ano
21.887
+21.887
0.0%
1 jan 1999 ano
25.286
+3.4
15.53%
1 jan 2000 ano
25.637
+0.351
1.39%
1 jan 2001 ano
26.143
+0.505
1.97%
1 jan 2002 ano
24.771
-1.372
-5.25%
1 jan 2003 ano
23.493
-1.278
-5.16%
1 jan 2004 ano
23.438
-0.054
-0.23%
1 jan 2005 ano
21.531
-1.907
-8.14%
1 jan 2006 ano
20.434
-1.097
-5.1%
1 jan 2007 ano
21.193
+0.759
3.71%
1 jan 2008 ano
20.74
-0.452
-2.13%
1 jan 2009 ano
21.708
+0.968
4.67%
1 jan 2010 ano
25.011
+3.303
15.22%
1 jan 2011 ano
21.951
-3.06
-12.23%
1 jan 2012 ano
22.143
+0.192
0.87%
1 jan 2013 ano
21.784
-0.359
-1.62%
1 jan 2014 ano
22.006
+0.222
1.02%
1 jan 2015 ano
22.794
+0.787
3.58%
Classificação de países por estatísticas atuais por anos


Comentários: