29
/pt/
pt
AIzaSyAYiBZKx7MnpbEhh9jyipgxe19OcubqV5w
April 1, 2024
209719
New Zealand
NZL
true
2
1
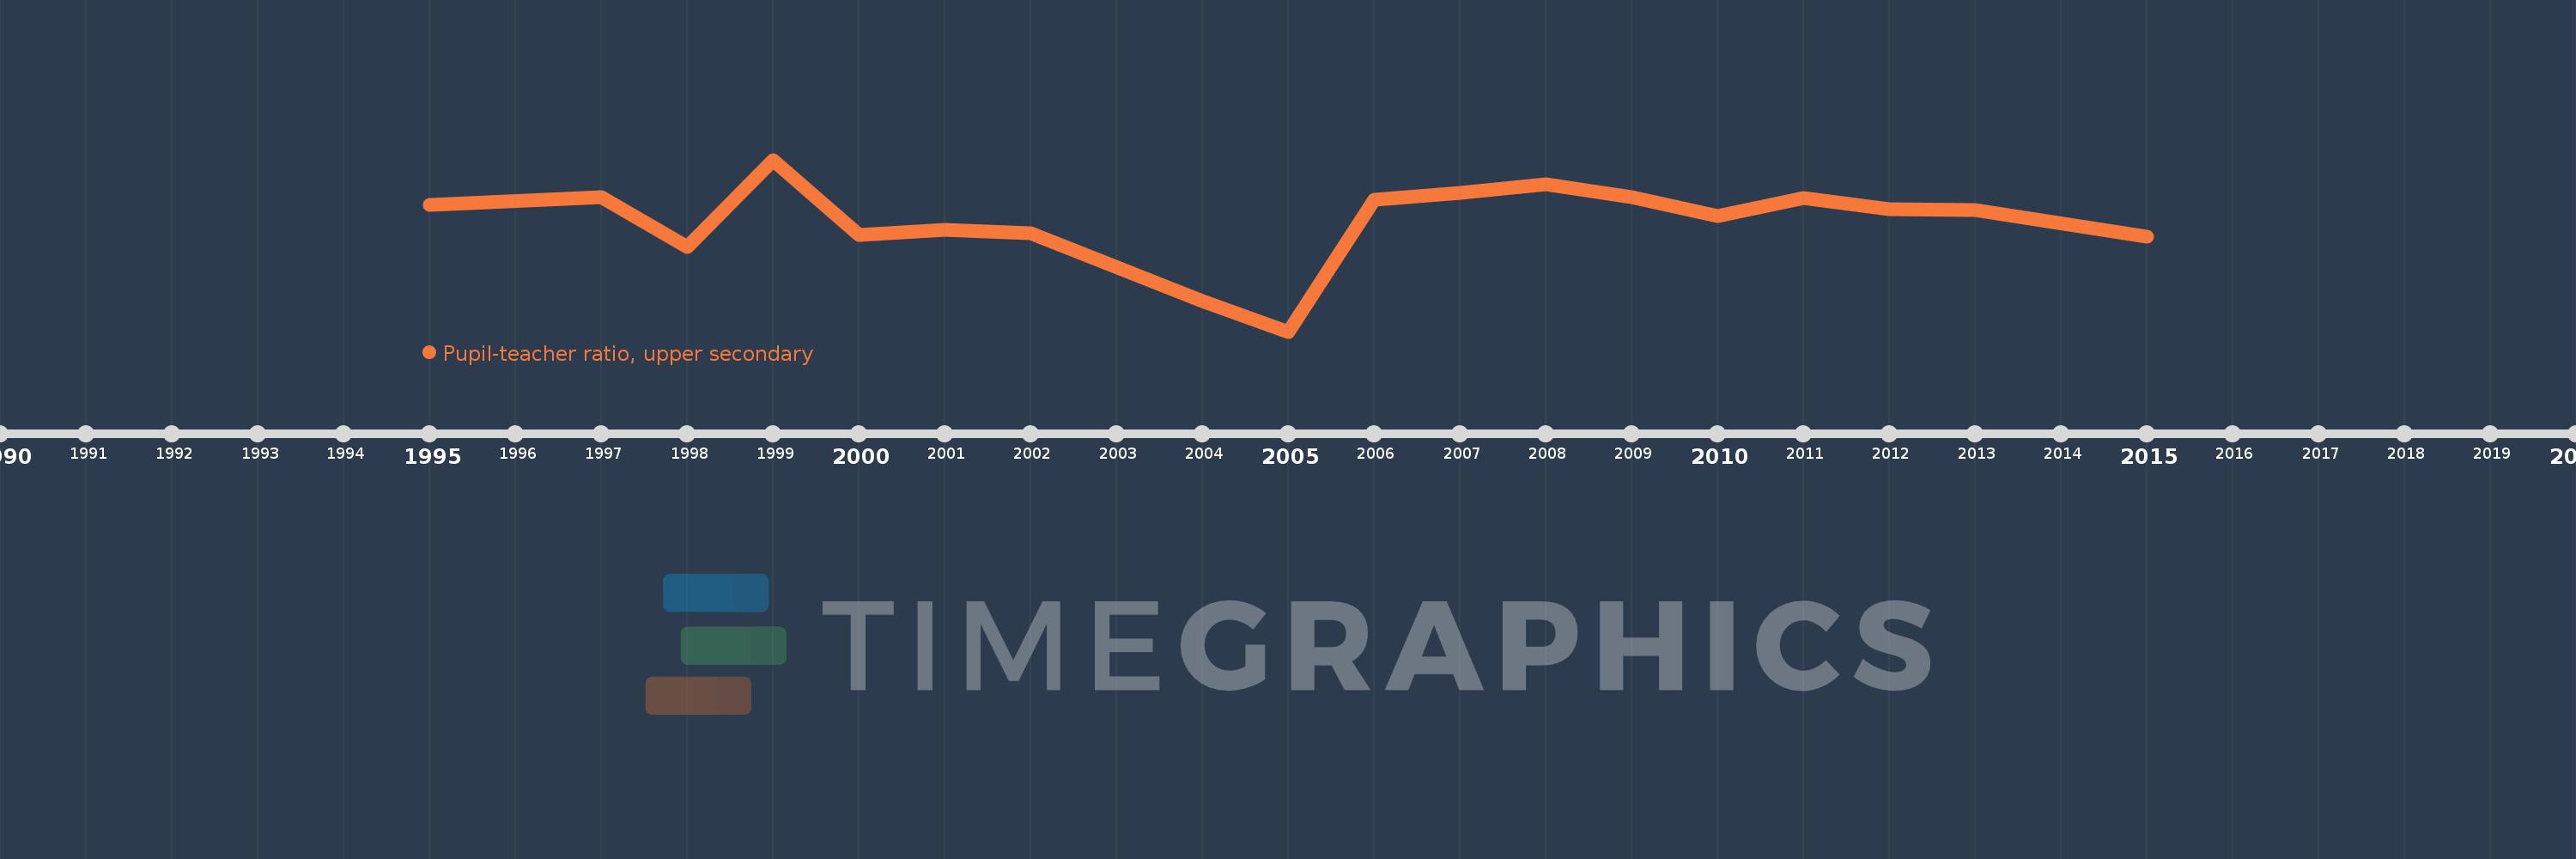
Pupil-teacher ratio, upper secondary
2015,2013,2012,2011,2010,2009,2008,2007,2006,2005,2004,2002,2001,2000,1999,1998,1997,1995
Estas estatísticas em outros países:
Linha do tempo:
Nesta escala de tempo está apresentado um gráfico de 1995 ano até 2015 ano New Zealand. Dados de 1994 ano ausente. O número de observações reais por data: 18.
Fonte (nome):
Indicadores de desenvolvimento mundial
Fonte (organização):
United Nations Educational, Scientific, and Cultural Organization (UNESCO) Institute for Statistics.
Categorias:
Education
Foi atualizado:
23 abr 2017 ano
Indicadores de alterações dos valores ao longo dos anos
Mínimo:
11.176
1 jan 2005 ano
Máximo:
15.046
1 jan 1999 ano
Na data de observação
Valor
Mudança absoluta
A alteração em relação ao valor anterior
1 jan 1995 ano
14.039
+14.039
0.0%
1 jan 1997 ano
14.213
+0.174
1.24%
1 jan 1998 ano
13.076
-1.137
-8.0%
1 jan 1999 ano
15.046
+1.97
15.07%
1 jan 2000 ano
13.355
-1.691
-11.24%
1 jan 2001 ano
13.468
+0.113
0.85%
1 jan 2002 ano
13.386
-0.082
-0.61%
1 jan 2004 ano
11.872
-1.514
-11.31%
1 jan 2005 ano
11.176
-0.696
-5.86%
1 jan 2006 ano
14.142
+2.965
26.53%
1 jan 2007 ano
14.293
+0.151
1.07%
1 jan 2008 ano
14.501
+0.208
1.45%
1 jan 2009 ano
14.207
-0.294
-2.03%
1 jan 2010 ano
13.772
-0.435
-3.06%
1 jan 2011 ano
14.186
+0.414
3.01%
1 jan 2012 ano
13.938
-0.248
-1.75%
1 jan 2013 ano
13.922
-0.015
-0.11%
1 jan 2015 ano
13.313
-0.609
-4.38%
Classificação de países por estatísticas atuais por anos


Comentários: