29
/pt/
pt
AIzaSyAYiBZKx7MnpbEhh9jyipgxe19OcubqV5w
April 1, 2024
36133
High income
HIC
false
2
1
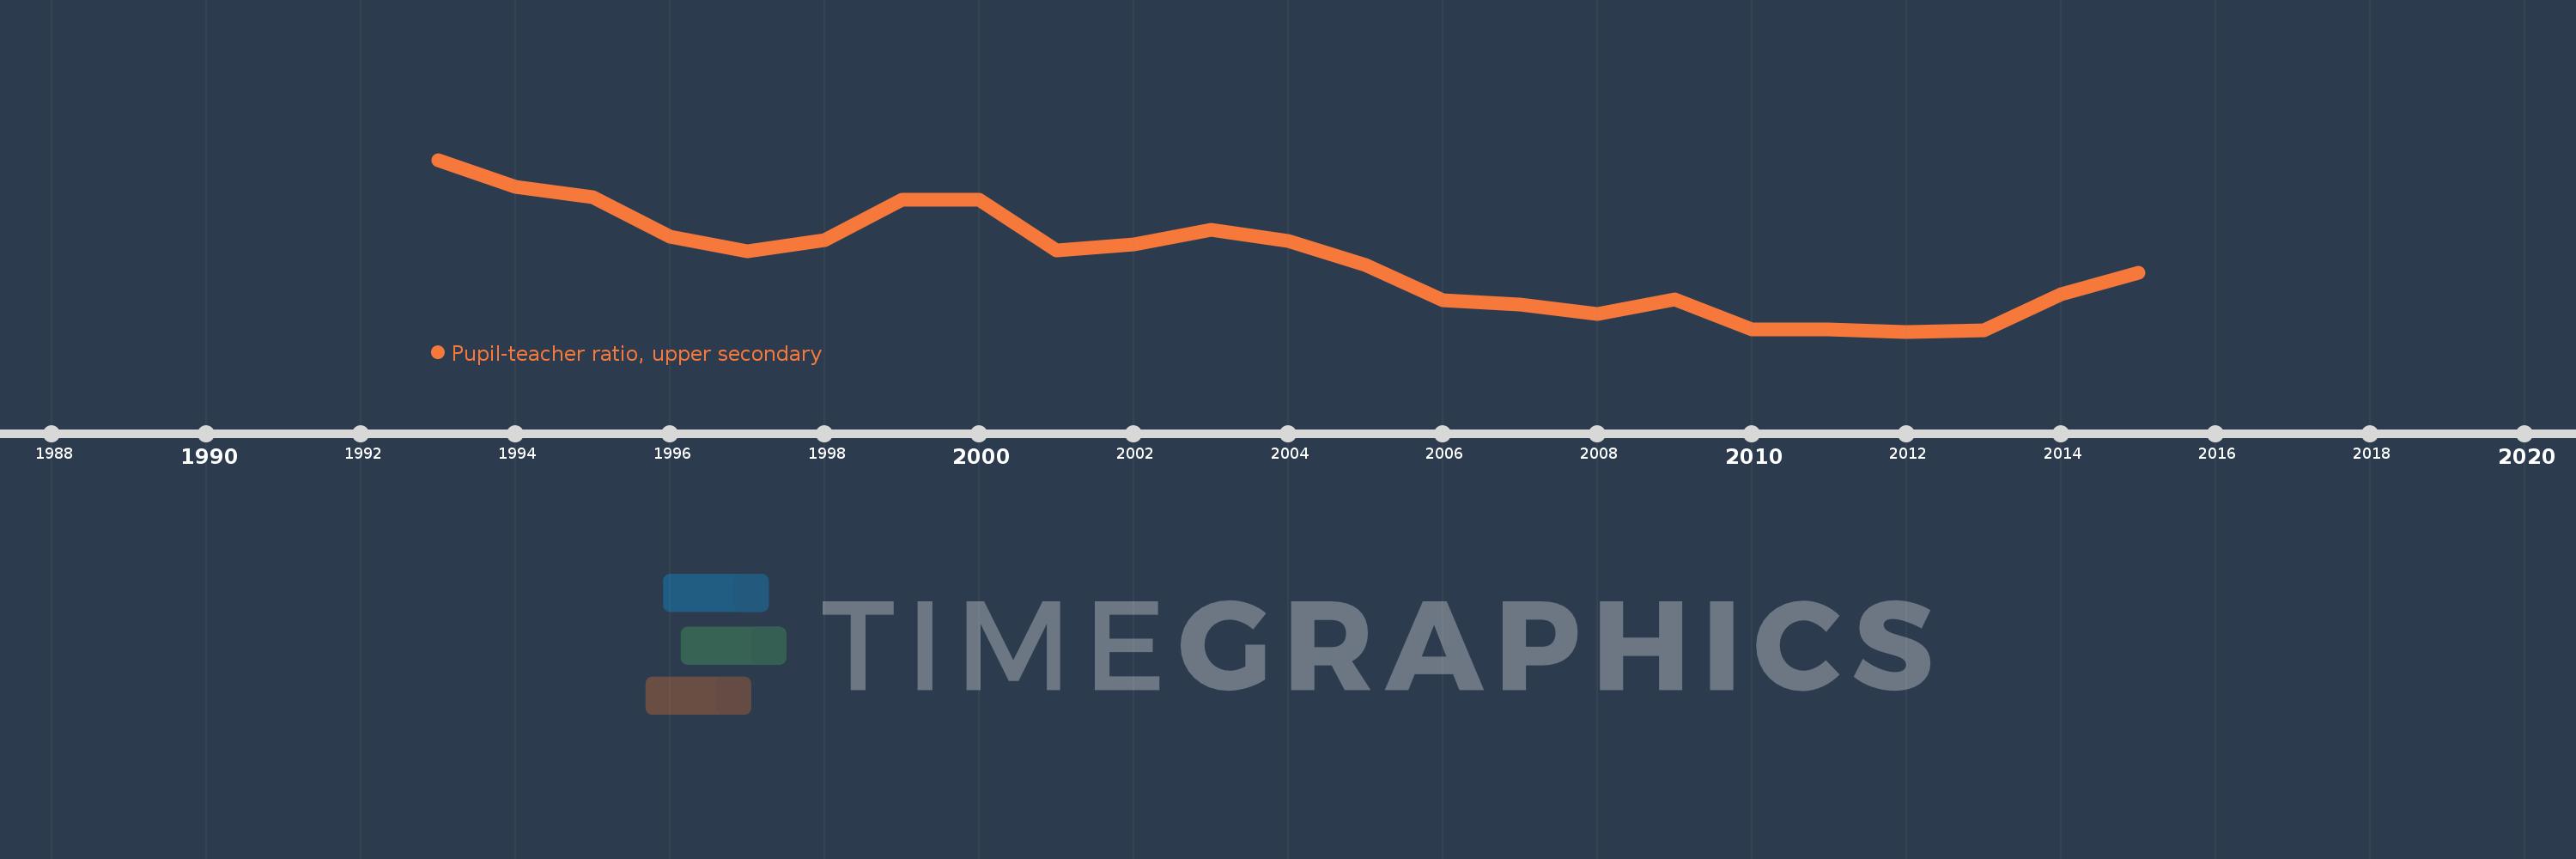
Pupil-teacher ratio, upper secondary
2015,2014,2013,2012,2011,2010,2009,2008,2007,2006,2005,2004,2003,2002,2001,2000,1999,1998,1997,1996,1995,1994,1993
Estas estatísticas em outros países:
Linha do tempo:
Nesta escala de tempo está apresentado um gráfico de 1993 ano até 2015 ano High income. Dados de 1992 ano ausente. O número de observações reais por data: 23.
Fonte (nome):
Indicadores de desenvolvimento mundial
Fonte (organização):
United Nations Educational, Scientific, and Cultural Organization (UNESCO) Institute for Statistics.
Categorias:
Education
Foi atualizado:
23 abr 2017 ano
Indicadores de alterações dos valores ao longo dos anos
Mínimo:
12.459
1 jan 2012 ano
Máximo:
13.554
1 jan 1993 ano
Na data de observação
Valor
Mudança absoluta
A alteração em relação ao valor anterior
1 jan 1993 ano
13.554
+13.554
0.0%
1 jan 1994 ano
13.382
-0.172
-1.27%
1 jan 1995 ano
13.314
-0.068
-0.51%
1 jan 1996 ano
13.064
-0.25
-1.88%
1 jan 1997 ano
12.972
-0.092
-0.7%
1 jan 1998 ano
13.041
+0.069
0.53%
1 jan 1999 ano
13.301
+0.26
1.99%
1 jan 2000 ano
13.298
-0.002
-0.02%
1 jan 2001 ano
12.975
-0.323
-2.43%
1 jan 2002 ano
13.012
+0.037
0.28%
1 jan 2003 ano
13.106
+0.095
0.73%
1 jan 2004 ano
13.038
-0.068
-0.52%
1 jan 2005 ano
12.884
-0.155
-1.19%
1 jan 2006 ano
12.658
-0.225
-1.75%
1 jan 2007 ano
12.633
-0.025
-0.2%
1 jan 2008 ano
12.572
-0.061
-0.48%
1 jan 2009 ano
12.666
+0.093
0.74%
1 jan 2010 ano
12.473
-0.193
-1.52%
1 jan 2011 ano
12.472
0.0
0.0%
1 jan 2012 ano
12.459
-0.014
-0.11%
1 jan 2013 ano
12.469
+0.01
0.08%
1 jan 2014 ano
12.699
+0.23
1.85%
1 jan 2015 ano
12.833
+0.134
1.06%
Classificação de países por estatísticas atuais por anos


Comentários: