29
/it/
it
AIzaSyAYiBZKx7MnpbEhh9jyipgxe19OcubqV5w
April 1, 2024
209719
New Zealand
NZL
true
2
1
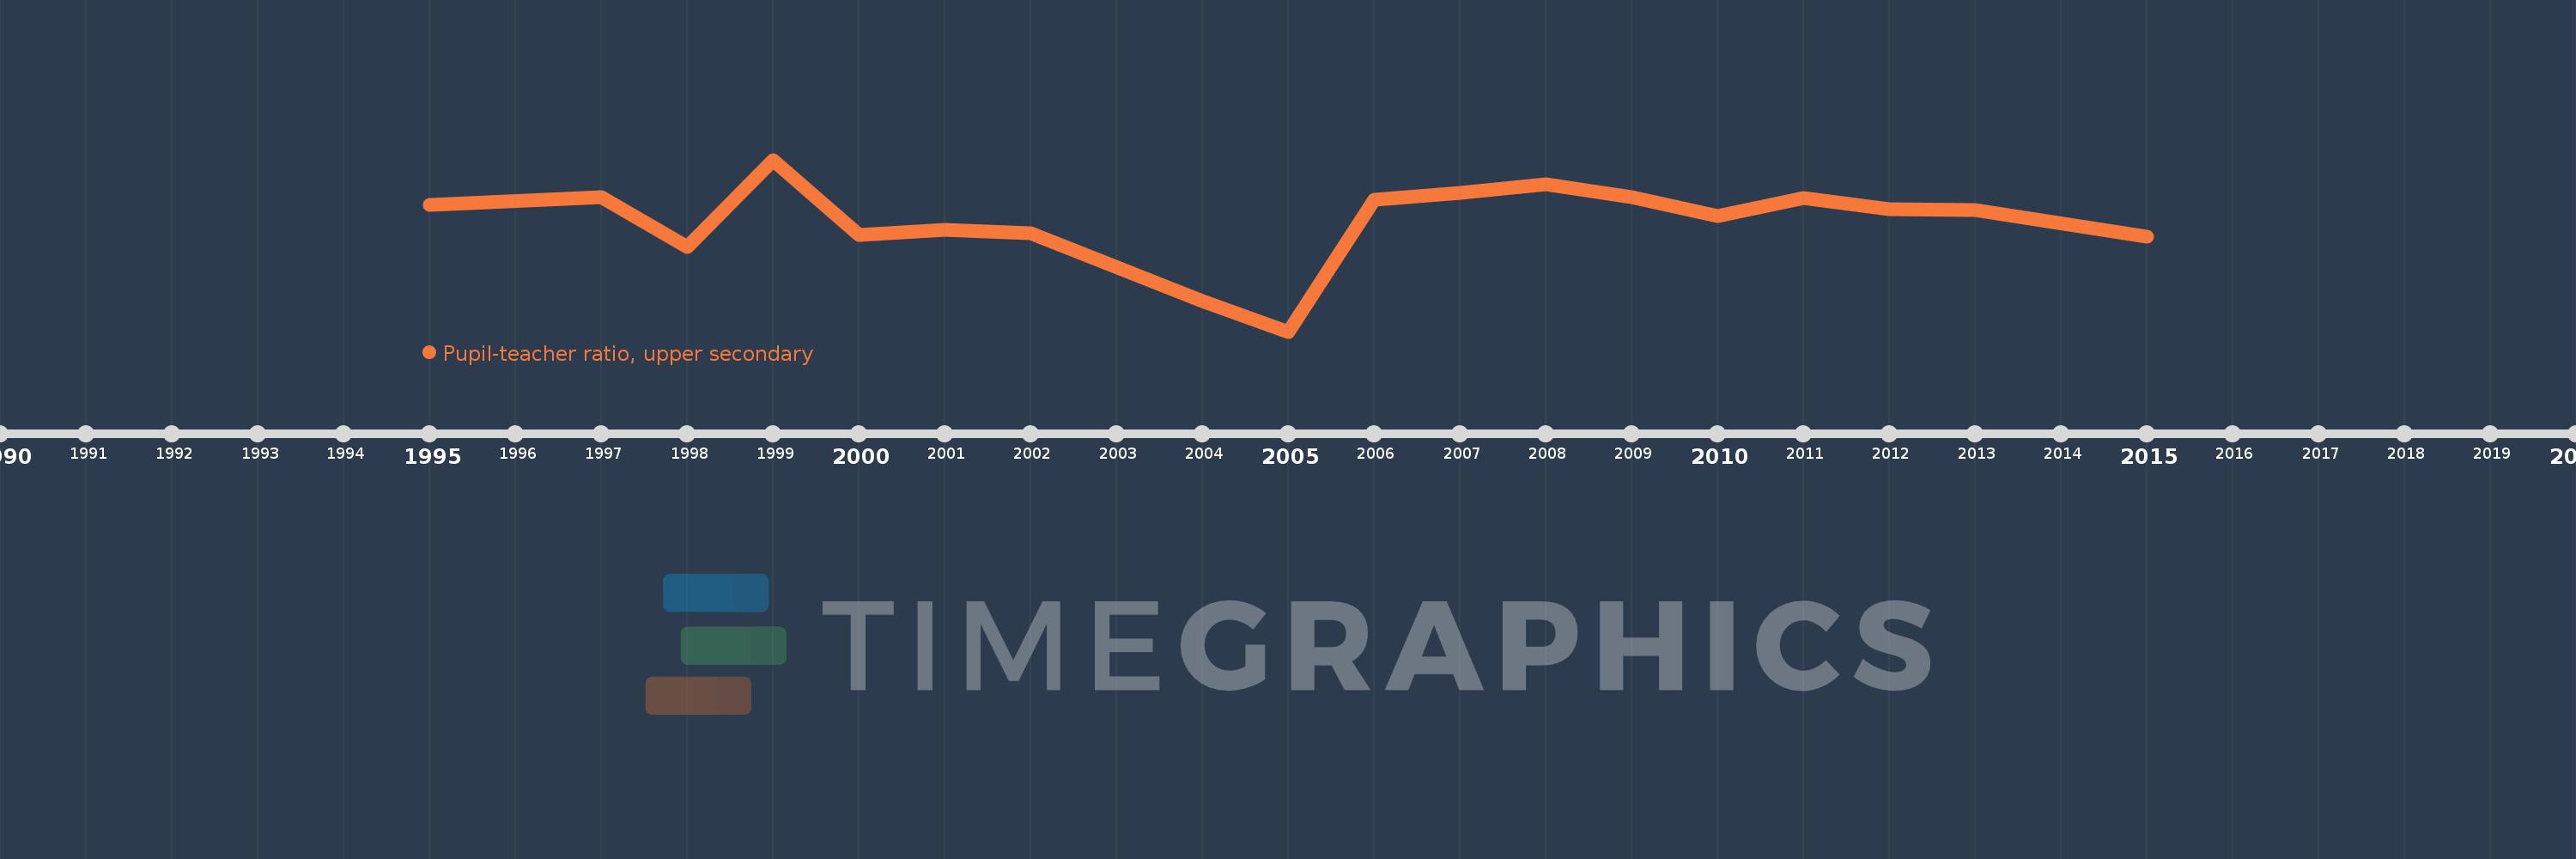
Pupil-teacher ratio, upper secondary
2015,2013,2012,2011,2010,2009,2008,2007,2006,2005,2004,2002,2001,2000,1999,1998,1997,1995
Queste statistiche in altri paesi:
Linea del tempo:
Questa scala temporale mostra un grafico dal 1995 anno al 2015 anno. New Zealand. I dati fino ad 1994 anno non disponibili. Il numero di osservazioni attuali secondo i date: 18.
La fonte (nome):
Indicatori dello sviluppo mondiale
La fonte (organizzazione):
United Nations Educational, Scientific, and Cultural Organization (UNESCO) Institute for Statistics.
Categorie:
Education
sono stati aggiornati
23 apr 2017 anni
Indicatori delle variazioni dei valori per anni
Minima:
11.176
1 gen 2005 anni
Massimo:
15.046
1 gen 1999 anni
Alla data di osservazione
Valore
Variazione assoluta
La variazione rispetto al valore precedente
1 gen 1995 anni
14.039
+14.039
0.0%
1 gen 1997 anni
14.213
+0.174
1.24%
1 gen 1998 anni
13.076
-1.137
-8.0%
1 gen 1999 anni
15.046
+1.97
15.07%
1 gen 2000 anni
13.355
-1.691
-11.24%
1 gen 2001 anni
13.468
+0.113
0.85%
1 gen 2002 anni
13.386
-0.082
-0.61%
1 gen 2004 anni
11.872
-1.514
-11.31%
1 gen 2005 anni
11.176
-0.696
-5.86%
1 gen 2006 anni
14.142
+2.965
26.53%
1 gen 2007 anni
14.293
+0.151
1.07%
1 gen 2008 anni
14.501
+0.208
1.45%
1 gen 2009 anni
14.207
-0.294
-2.03%
1 gen 2010 anni
13.772
-0.435
-3.06%
1 gen 2011 anni
14.186
+0.414
3.01%
1 gen 2012 anni
13.938
-0.248
-1.75%
1 gen 2013 anni
13.922
-0.015
-0.11%
1 gen 2015 anni
13.313
-0.609
-4.38%
Classificazione dei paesi secondo i statistiche attuali per anni


Commenti: