29
/it/
it
AIzaSyAYiBZKx7MnpbEhh9jyipgxe19OcubqV5w
April 1, 2024
44621
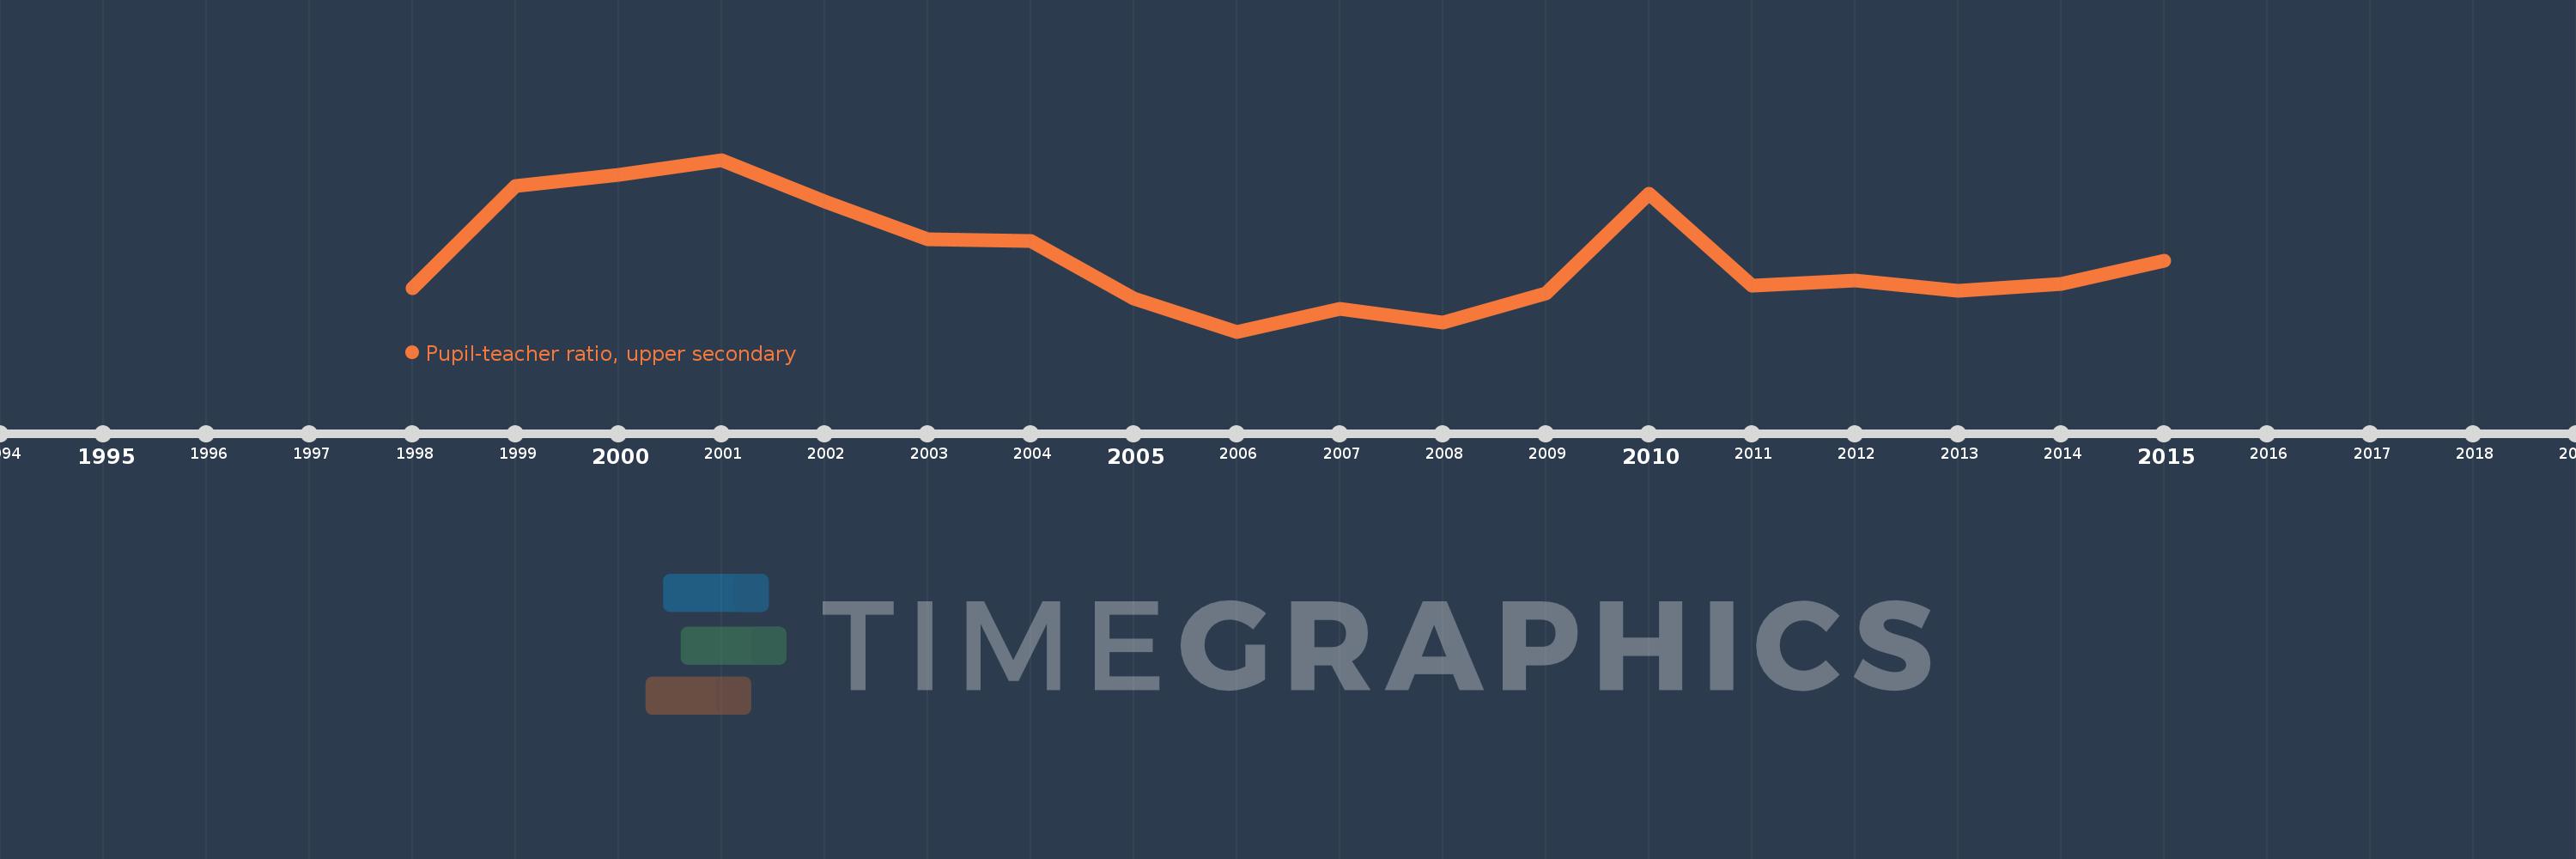
Least developed countries: UN classification
LDC
false
2
1
Pupil-teacher ratio, upper secondary
2015,2014,2013,2012,2011,2010,2009,2008,2007,2006,2005,2004,2003,2002,2001,2000,1999,1998
Queste statistiche in altri paesi:
Linea del tempo:
Questa scala temporale mostra un grafico dal 1998 anno al 2015 anno. Least developed countries: UN classification. I dati fino ad 1997 anno non disponibili. Il numero di osservazioni attuali secondo i date: 18.
La fonte (nome):
Indicatori dello sviluppo mondiale
La fonte (organizzazione):
United Nations Educational, Scientific, and Cultural Organization (UNESCO) Institute for Statistics.
Categorie:
Education
sono stati aggiornati
23 apr 2017 anni
Indicatori delle variazioni dei valori per anni
Minima:
20.434
1 gen 2006 anni
Massimo:
26.143
1 gen 2001 anni
Alla data di osservazione
Valore
Variazione assoluta
La variazione rispetto al valore precedente
1 gen 1998 anni
21.887
+21.887
0.0%
1 gen 1999 anni
25.286
+3.4
15.53%
1 gen 2000 anni
25.637
+0.351
1.39%
1 gen 2001 anni
26.143
+0.505
1.97%
1 gen 2002 anni
24.771
-1.372
-5.25%
1 gen 2003 anni
23.493
-1.278
-5.16%
1 gen 2004 anni
23.438
-0.054
-0.23%
1 gen 2005 anni
21.531
-1.907
-8.14%
1 gen 2006 anni
20.434
-1.097
-5.1%
1 gen 2007 anni
21.193
+0.759
3.71%
1 gen 2008 anni
20.74
-0.452
-2.13%
1 gen 2009 anni
21.708
+0.968
4.67%
1 gen 2010 anni
25.011
+3.303
15.22%
1 gen 2011 anni
21.951
-3.06
-12.23%
1 gen 2012 anni
22.143
+0.192
0.87%
1 gen 2013 anni
21.784
-0.359
-1.62%
1 gen 2014 anni
22.006
+0.222
1.02%
1 gen 2015 anni
22.794
+0.787
3.58%
Classificazione dei paesi secondo i statistiche attuali per anni


Commenti: