29
/it/
it
AIzaSyAYiBZKx7MnpbEhh9jyipgxe19OcubqV5w
April 1, 2024
39507
IDA only
IDX
false
2
1
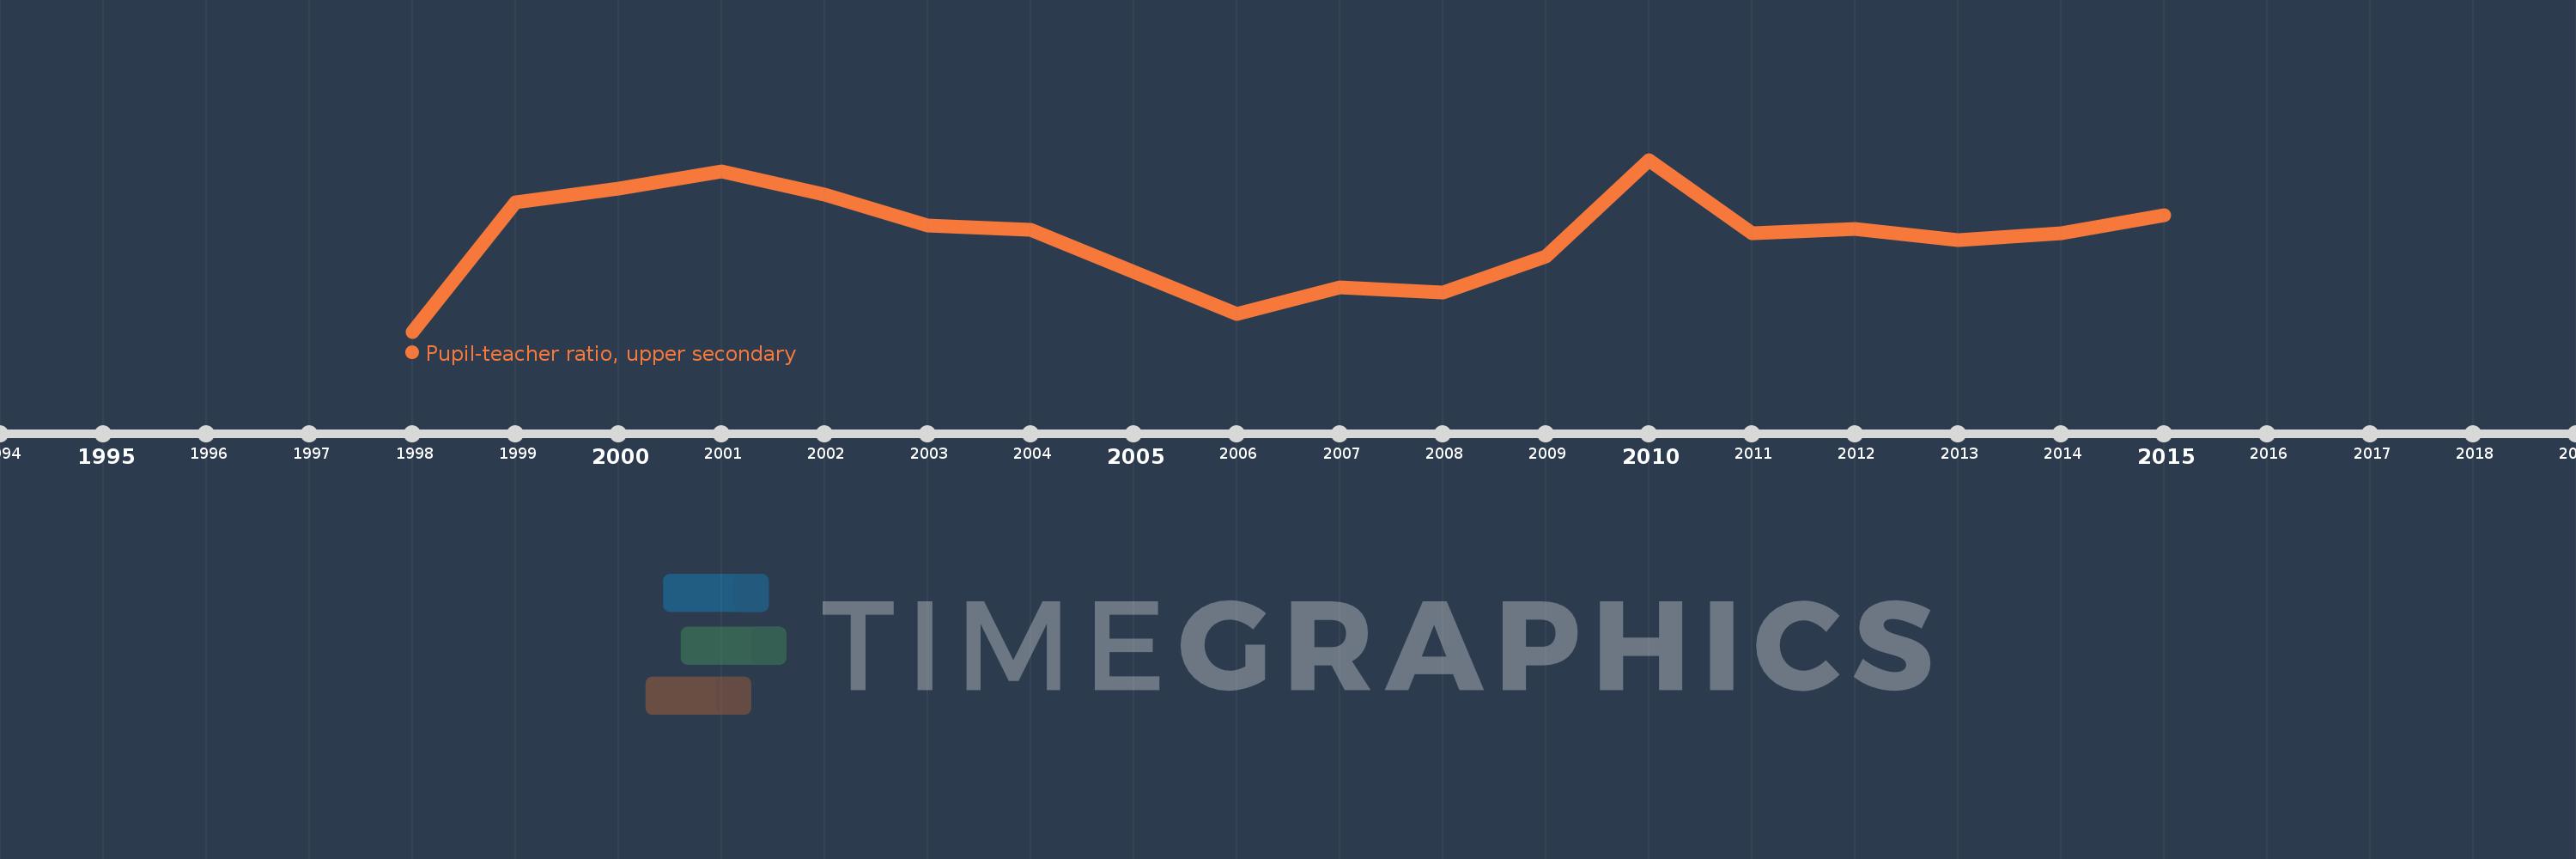
Pupil-teacher ratio, upper secondary
2015,2014,2013,2012,2011,2010,2009,2008,2007,2006,2005,2004,2003,2002,2001,2000,1999,1998
Queste statistiche in altri paesi:
Linea del tempo:
Questa scala temporale mostra un grafico dal 1998 anno al 2015 anno. IDA only. I dati fino ad 1997 anno non disponibili. Il numero di osservazioni attuali secondo i date: 18.
La fonte (nome):
Indicatori dello sviluppo mondiale
La fonte (organizzazione):
United Nations Educational, Scientific, and Cultural Organization (UNESCO) Institute for Statistics.
Categorie:
Education
sono stati aggiornati
23 apr 2017 anni
Indicatori delle variazioni dei valori per anni
Minima:
18.777
1 gen 1998 anni
Massimo:
23.559
1 gen 2010 anni
Alla data di osservazione
Valore
Variazione assoluta
La variazione rispetto al valore precedente
1 gen 1998 anni
18.777
+18.777
0.0%
1 gen 1999 anni
22.385
+3.608
19.22%
1 gen 2000 anni
22.765
+0.381
1.7%
1 gen 2001 anni
23.245
+0.479
2.11%
1 gen 2002 anni
22.59
-0.655
-2.82%
1 gen 2003 anni
21.725
-0.865
-3.83%
1 gen 2004 anni
21.62
-0.106
-0.49%
1 gen 2005 anni
20.432
-1.188
-5.5%
1 gen 2006 anni
19.259
-1.173
-5.74%
1 gen 2007 anni
20.007
+0.748
3.88%
1 gen 2008 anni
19.86
-0.147
-0.73%
1 gen 2009 anni
20.863
+1.003
5.05%
1 gen 2010 anni
23.559
+2.696
12.92%
1 gen 2011 anni
21.52
-2.039
-8.65%
1 gen 2012 anni
21.628
+0.108
0.5%
1 gen 2013 anni
21.325
-0.303
-1.4%
1 gen 2014 anni
21.525
+0.2
0.94%
1 gen 2015 anni
22.008
+0.482
2.24%
Classificazione dei paesi secondo i statistiche attuali per anni


Commenti: