29
/pt/
pt
AIzaSyAYiBZKx7MnpbEhh9jyipgxe19OcubqV5w
April 1, 2024
44432
Least developed countries: UN classification
LDC
false
2
1
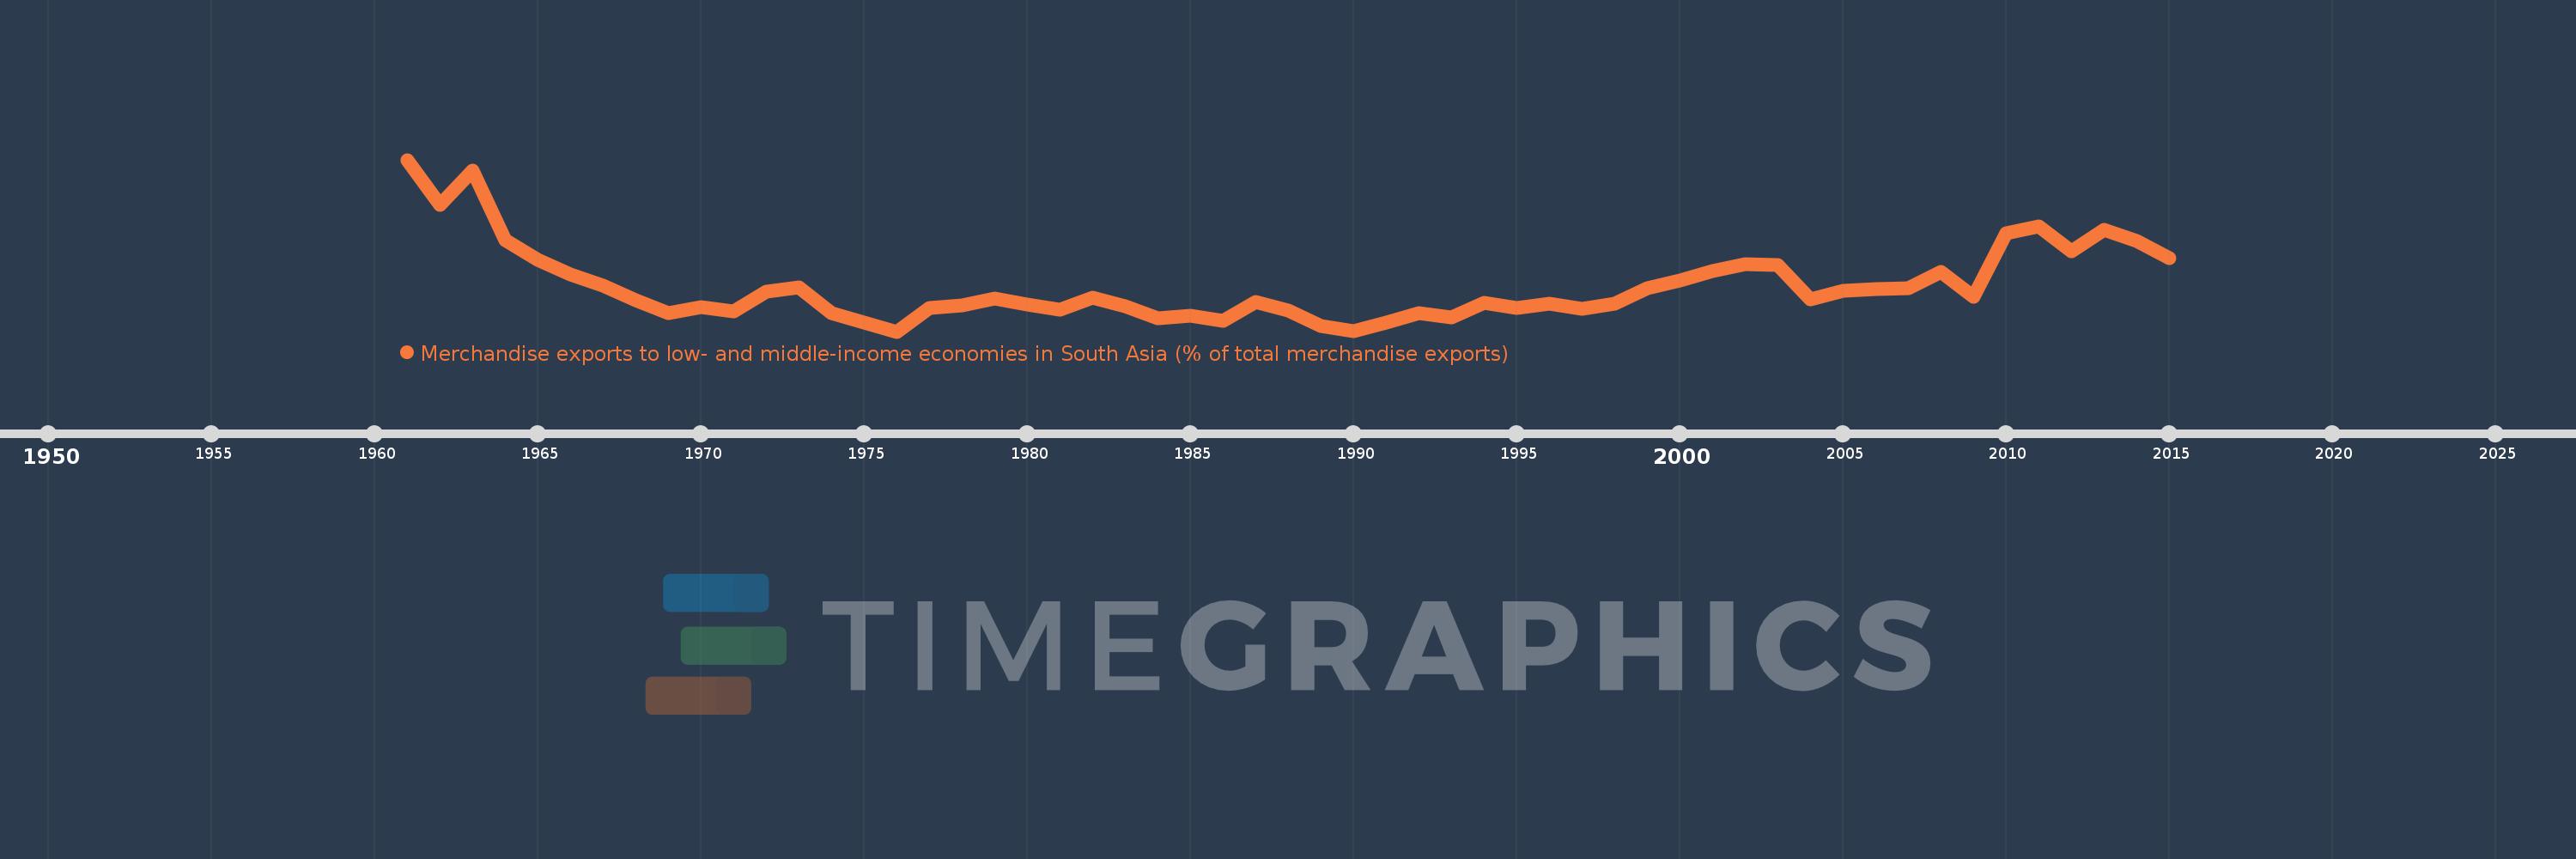
Merchandise exports to low- and middle-income economies in South Asia (% of total merchandise exports)
2015,2014,2013,2012,2011,2010,2009,2008,2007,2006,2005,2004,2003,2002,2001,2000,1999,1998,1997,1996,1995,1994,1993,1992,1991,1990,1989,1988,1987,1986,1985,1984,1983,1982,1981,1980,1979,1978,1977,1976,1975,1974,1973,1972,1971,1970,1969,1968,1967,1966,1965,1964,1963,1962,1961
Estas estatísticas em outros países:
AfghanistanAlbaniaAlgeriaAngolaAntigua and BarbudaArab WorldArgentinaArmeniaArubaAustraliaAustriaAzerbaijanBahamas, TheBahrainBangladeshBarbadosBelarusBelgiumBelizeBeninBermudaBoliviaBrazilBrunei DarussalamBulgariaBurkina FasoBurundiCabo VerdeCambodiaCameroonCanadaCaribbean small statesCentral African RepublicCentral Europe and the BalticsChadChileChinaColombiaCongo, Rep.Costa RicaCote d'IvoireCroatiaCyprusCzech RepublicDenmarkDjiboutiDominicaDominican RepublicEarly-demographic dividendEast Asia & PacificEast Asia & Pacific (excluding high income)East Asia & Pacific (IDA & IBRD countries)EcuadorEgypt, Arab Rep.El SalvadorEstoniaEthiopiaEuro areaEurope & Central AsiaEurope & Central Asia (excluding high income)Europe & Central Asia (IDA & IBRD countries)European UnionFaroe IslandsFijiFinlandFragile and conflict affected situationsFranceGabonGambia, TheGeorgiaGermanyGhanaGibraltarGreeceGreenlandGrenadaGuatemalaGuineaGuyanaHaitiHeavily indebted poor countries (HIPC)High incomeHondurasHong Kong SAR, ChinaHungaryIBRD onlyIcelandIDA & IBRD totalIDA blendIDA onlyIDA totalIndiaIndonesiaIran, Islamic Rep.IraqIrelandIsraelItalyJamaicaJapanJordanKazakhstanKenyaKiribatiKorea, Dem. People’s Rep.Korea, Rep.KosovoKuwaitKyrgyz RepublicLao PDRLate-demographic dividendLatin America & Caribbean Latin America & Caribbean (excluding high income)Latin America & the Caribbean (IDA & IBRD countries)LatviaLeast developed countries: UN classificationLebanonLiberiaLibyaLithuaniaLow & middle incomeLow incomeLower middle incomeLuxembourgMacao SAR, ChinaMacedonia, FYRMadagascarMalawiMalaysiaMaldivesMaliMaltaMauritaniaMauritiusMexicoMiddle East & North AfricaMiddle East & North Africa (excluding high income)Middle East & North Africa (IDA & IBRD countries)Middle incomeMoldovaMongoliaMontenegroMoroccoMozambiqueMyanmarNauruNepalNetherlandsNew CaledoniaNew ZealandNicaraguaNigerNigeriaNorth AmericaNorwayOECD membersOmanOther small statesPacific island small statesPakistanPanamaPapua New GuineaParaguayPeruPhilippinesPolandPortugalPost-demographic dividendPre-demographic dividendQatarRomaniaRussian FederationRwandaSamoaSaudi ArabiaSenegalSerbiaSeychellesSierra LeoneSingaporeSlovak RepublicSloveniaSmall statesSomaliaSouth AfricaSouth AsiaSouth Asia (IDA & IBRD)SpainSri LankaSt. LuciaSt. Vincent and the GrenadinesSub-Saharan Africa Sub-Saharan Africa (excluding high income)Sub-Saharan Africa (IDA & IBRD countries)SudanSurinameSwedenSwitzerlandSyrian Arab RepublicTajikistanTanzaniaThailandTogoTongaTrinidad and TobagoTunisiaTurkeyTurkmenistanUgandaUkraineUnited Arab EmiratesUnited KingdomUnited StatesUpper middle incomeUruguayVanuatuVenezuela, RBVietnamWorldYemen, Rep.ZambiaZimbabwe Linha do tempo:
Nesta escala de tempo está apresentado um gráfico de 1961 ano até 2015 ano Least developed countries: UN classification. Dados de 1960 ano ausente. O número de observações reais por data: 55.
Fonte (nome):
Indicadores de desenvolvimento mundial
Fonte (organização):
World Bank staff estimates based data from International Monetary Fund's Direction of Trade database.
Categorias:
Private Sector, Trade
Foi atualizado:
23 abr 2017 ano
Indicadores de alterações dos valores ao longo dos anos
Mínimo:
2.082
1 jan 1976 ano
Máximo:
10.219
1 jan 1961 ano
Na data de observação
Valor
Mudança absoluta
A alteração em relação ao valor anterior
1 jan 1961 ano
10.219
+10.219
0.0%
1 jan 1962 ano
8.098
-2.121
-20.76%
1 jan 1963 ano
9.726
+1.628
20.11%
1 jan 1964 ano
6.429
-3.297
-33.9%
1 jan 1965 ano
5.495
-0.934
-14.53%
1 jan 1966 ano
4.782
-0.713
-12.97%
1 jan 1967 ano
4.262
-0.521
-10.89%
1 jan 1968 ano
3.576
-0.685
-16.08%
1 jan 1969 ano
2.96
-0.616
-17.23%
1 jan 1970 ano
3.259
+0.299
10.11%
1 jan 1971 ano
3.039
-0.221
-6.77%
1 jan 1972 ano
3.985
+0.946
31.13%
1 jan 1973 ano
4.157
+0.172
4.32%
1 jan 1974 ano
2.97
-1.187
-28.56%
1 jan 1975 ano
2.49
-0.48
-16.15%
1 jan 1976 ano
2.082
-0.409
-16.41%
1 jan 1977 ano
3.191
+1.11
53.31%
1 jan 1978 ano
3.336
+0.145
4.54%
1 jan 1979 ano
3.653
+0.317
9.49%
1 jan 1980 ano
3.372
-0.28
-7.67%
1 jan 1981 ano
3.136
-0.237
-7.01%
1 jan 1982 ano
3.706
+0.57
18.17%
1 jan 1983 ano
3.265
-0.441
-11.89%
1 jan 1984 ano
2.732
-0.533
-16.33%
1 jan 1985 ano
2.844
+0.112
4.09%
1 jan 1986 ano
2.588
-0.256
-9.01%
1 jan 1987 ano
3.483
+0.895
34.58%
1 jan 1988 ano
3.065
-0.418
-12.0%
1 jan 1989 ano
2.354
-0.711
-23.2%
1 jan 1990 ano
2.113
-0.241
-10.22%
1 jan 1991 ano
2.526
+0.413
19.56%
1 jan 1992 ano
2.966
+0.439
17.38%
1 jan 1993 ano
2.757
-0.209
-7.04%
1 jan 1994 ano
3.463
+0.706
25.61%
1 jan 1995 ano
3.184
-0.279
-8.05%
1 jan 1996 ano
3.418
+0.234
7.35%
1 jan 1997 ano
3.155
-0.263
-7.68%
1 jan 1998 ano
3.39
+0.235
7.45%
1 jan 1999 ano
4.119
+0.728
21.48%
1 jan 2000 ano
4.496
+0.377
9.16%
1 jan 2001 ano
4.949
+0.453
10.08%
1 jan 2002 ano
5.268
+0.318
6.43%
1 jan 2003 ano
5.219
-0.049
-0.93%
1 jan 2004 ano
3.588
-1.631
-31.25%
1 jan 2005 ano
4.012
+0.424
11.81%
1 jan 2006 ano
4.102
+0.09
2.25%
1 jan 2007 ano
4.155
+0.053
1.29%
1 jan 2008 ano
4.913
+0.758
18.25%
1 jan 2009 ano
3.72
-1.193
-24.28%
1 jan 2010 ano
6.75
+3.03
81.46%
1 jan 2011 ano
7.086
+0.335
4.97%
1 jan 2012 ano
5.87
-1.216
-17.16%
1 jan 2013 ano
6.894
+1.025
17.46%
1 jan 2014 ano
6.356
-0.538
-7.8%
1 jan 2015 ano
5.571
-0.785
-12.35%
Classificação de países por estatísticas atuais por anos


Comentários: