29
/pt/
pt
AIzaSyAYiBZKx7MnpbEhh9jyipgxe19OcubqV5w
April 1, 2024
257557
Switzerland
CHE
true
2
1
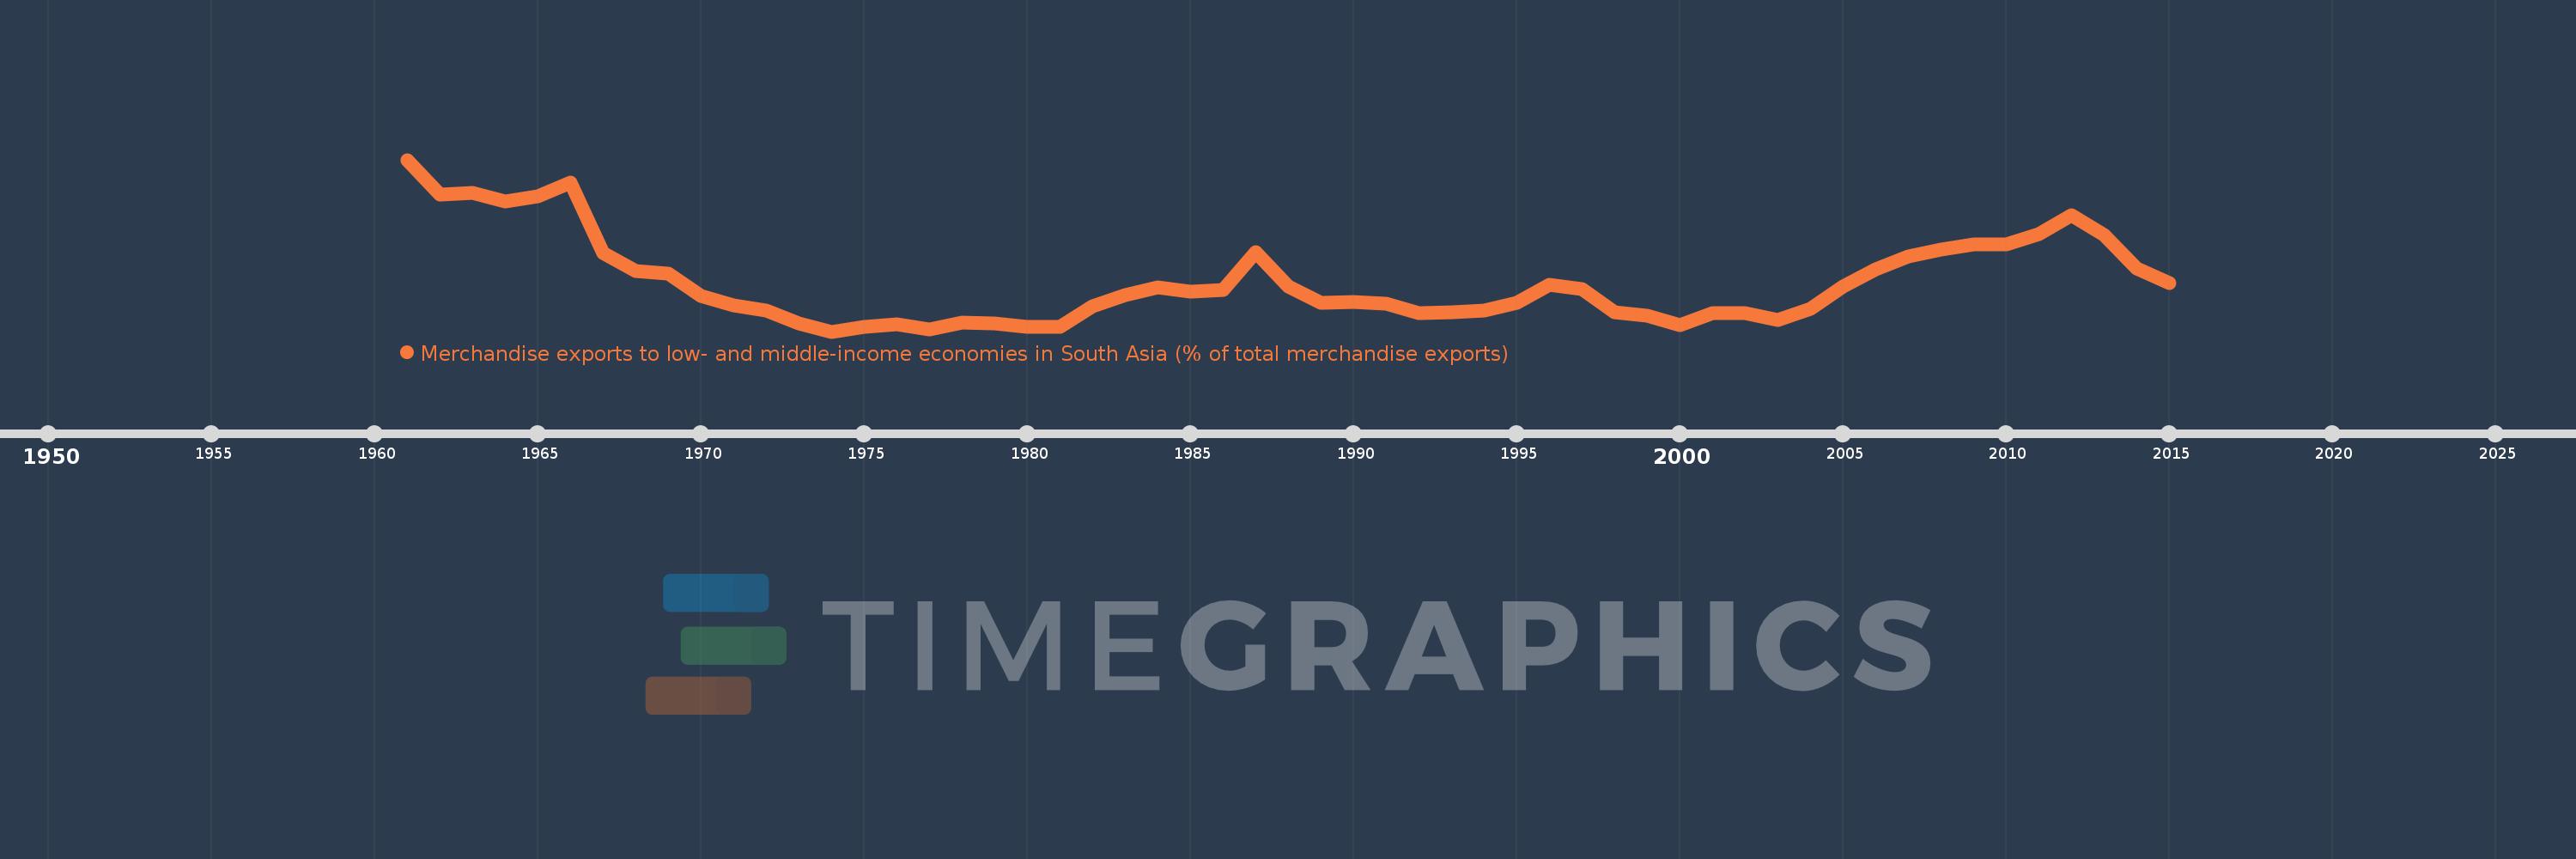
Merchandise exports to low- and middle-income economies in South Asia (% of total merchandise exports)
2015,2014,2013,2012,2011,2010,2009,2008,2007,2006,2005,2004,2003,2002,2001,2000,1999,1998,1997,1996,1995,1994,1993,1992,1991,1990,1989,1988,1987,1986,1985,1984,1983,1982,1981,1980,1979,1978,1977,1976,1975,1974,1973,1972,1971,1970,1969,1968,1967,1966,1965,1964,1963,1962,1961
Estas estatísticas em outros países:
AfghanistanAlbaniaAlgeriaAngolaAntigua and BarbudaArab WorldArgentinaArmeniaArubaAustraliaAustriaAzerbaijanBahamas, TheBahrainBangladeshBarbadosBelarusBelgiumBelizeBeninBermudaBoliviaBrazilBrunei DarussalamBulgariaBurkina FasoBurundiCabo VerdeCambodiaCameroonCanadaCaribbean small statesCentral African RepublicCentral Europe and the BalticsChadChileChinaColombiaCongo, Rep.Costa RicaCote d'IvoireCroatiaCyprusCzech RepublicDenmarkDjiboutiDominicaDominican RepublicEarly-demographic dividendEast Asia & PacificEast Asia & Pacific (excluding high income)East Asia & Pacific (IDA & IBRD countries)EcuadorEgypt, Arab Rep.El SalvadorEstoniaEthiopiaEuro areaEurope & Central AsiaEurope & Central Asia (excluding high income)Europe & Central Asia (IDA & IBRD countries)European UnionFaroe IslandsFijiFinlandFragile and conflict affected situationsFranceGabonGambia, TheGeorgiaGermanyGhanaGibraltarGreeceGreenlandGrenadaGuatemalaGuineaGuyanaHaitiHeavily indebted poor countries (HIPC)High incomeHondurasHong Kong SAR, ChinaHungaryIBRD onlyIcelandIDA & IBRD totalIDA blendIDA onlyIDA totalIndiaIndonesiaIran, Islamic Rep.IraqIrelandIsraelItalyJamaicaJapanJordanKazakhstanKenyaKiribatiKorea, Dem. People’s Rep.Korea, Rep.KosovoKuwaitKyrgyz RepublicLao PDRLate-demographic dividendLatin America & Caribbean Latin America & Caribbean (excluding high income)Latin America & the Caribbean (IDA & IBRD countries)LatviaLeast developed countries: UN classificationLebanonLiberiaLibyaLithuaniaLow & middle incomeLow incomeLower middle incomeLuxembourgMacao SAR, ChinaMacedonia, FYRMadagascarMalawiMalaysiaMaldivesMaliMaltaMauritaniaMauritiusMexicoMiddle East & North AfricaMiddle East & North Africa (excluding high income)Middle East & North Africa (IDA & IBRD countries)Middle incomeMoldovaMongoliaMontenegroMoroccoMozambiqueMyanmarNauruNepalNetherlandsNew CaledoniaNew ZealandNicaraguaNigerNigeriaNorth AmericaNorwayOECD membersOmanOther small statesPacific island small statesPakistanPanamaPapua New GuineaParaguayPeruPhilippinesPolandPortugalPost-demographic dividendPre-demographic dividendQatarRomaniaRussian FederationRwandaSamoaSaudi ArabiaSenegalSerbiaSeychellesSierra LeoneSingaporeSlovak RepublicSloveniaSmall statesSomaliaSouth AfricaSouth AsiaSouth Asia (IDA & IBRD)SpainSri LankaSt. LuciaSt. Vincent and the GrenadinesSub-Saharan Africa Sub-Saharan Africa (excluding high income)Sub-Saharan Africa (IDA & IBRD countries)SudanSurinameSwedenSwitzerlandSyrian Arab RepublicTajikistanTanzaniaThailandTogoTongaTrinidad and TobagoTunisiaTurkeyTurkmenistanUgandaUkraineUnited Arab EmiratesUnited KingdomUnited StatesUpper middle incomeUruguayVanuatuVenezuela, RBVietnamWorldYemen, Rep.ZambiaZimbabwe Linha do tempo:
Nesta escala de tempo está apresentado um gráfico de 1961 ano até 2015 ano Switzerland. Dados de 1960 ano ausente. O número de observações reais por data: 55.
Fonte (nome):
Indicadores de desenvolvimento mundial
Fonte (organização):
World Bank staff estimates based data from International Monetary Fund's Direction of Trade database.
Categorias:
Private Sector, Trade
Foi atualizado:
23 abr 2017 ano
Indicadores de alterações dos valores ao longo dos anos
Mínimo:
0.59
1 jan 1974 ano
Máximo:
2.206
1 jan 1961 ano
Na data de observação
Valor
Mudança absoluta
A alteração em relação ao valor anterior
1 jan 1961 ano
2.206
+2.206
0.0%
1 jan 1962 ano
1.878
-0.328
-14.86%
1 jan 1963 ano
1.892
+0.014
0.73%
1 jan 1964 ano
1.811
-0.081
-4.3%
1 jan 1965 ano
1.863
+0.052
2.88%
1 jan 1966 ano
1.989
+0.126
6.75%
1 jan 1967 ano
1.327
-0.662
-33.3%
1 jan 1968 ano
1.163
-0.163
-12.32%
1 jan 1969 ano
1.134
-0.029
-2.52%
1 jan 1970 ano
0.927
-0.207
-18.23%
1 jan 1971 ano
0.838
-0.089
-9.63%
1 jan 1972 ano
0.788
-0.05
-5.99%
1 jan 1973 ano
0.666
-0.121
-15.38%
1 jan 1974 ano
0.59
-0.076
-11.39%
1 jan 1975 ano
0.633
+0.042
7.13%
1 jan 1976 ano
0.659
+0.027
4.25%
1 jan 1977 ano
0.613
-0.046
-7.04%
1 jan 1978 ano
0.678
+0.065
10.63%
1 jan 1979 ano
0.664
-0.014
-2.11%
1 jan 1980 ano
0.636
-0.028
-4.17%
1 jan 1981 ano
0.634
-0.002
-0.36%
1 jan 1982 ano
0.831
+0.197
31.11%
1 jan 1983 ano
0.937
+0.106
12.77%
1 jan 1984 ano
1.003
+0.066
7.05%
1 jan 1985 ano
0.969
-0.035
-3.44%
1 jan 1986 ano
0.983
+0.015
1.51%
1 jan 1987 ano
1.337
+0.354
35.96%
1 jan 1988 ano
1.013
-0.324
-24.26%
1 jan 1989 ano
0.862
-0.151
-14.91%
1 jan 1990 ano
0.865
+0.003
0.4%
1 jan 1991 ano
0.854
-0.011
-1.33%
1 jan 1992 ano
0.762
-0.091
-10.7%
1 jan 1993 ano
0.774
+0.012
1.51%
1 jan 1994 ano
0.787
+0.013
1.68%
1 jan 1995 ano
0.86
+0.074
9.34%
1 jan 1996 ano
1.03
+0.169
19.7%
1 jan 1997 ano
0.994
-0.036
-3.48%
1 jan 1998 ano
0.772
-0.222
-22.32%
1 jan 1999 ano
0.738
-0.034
-4.37%
1 jan 2000 ano
0.653
-0.085
-11.49%
1 jan 2001 ano
0.76
+0.107
16.31%
1 jan 2002 ano
0.76
+0.0
0.04%
1 jan 2003 ano
0.7
-0.06
-7.89%
1 jan 2004 ano
0.805
+0.105
14.97%
1 jan 2005 ano
1.016
+0.211
26.19%
1 jan 2006 ano
1.178
+0.162
15.92%
1 jan 2007 ano
1.295
+0.117
9.97%
1 jan 2008 ano
1.364
+0.069
5.33%
1 jan 2009 ano
1.411
+0.047
3.41%
1 jan 2010 ano
1.414
+0.003
0.23%
1 jan 2011 ano
1.51
+0.096
6.78%
1 jan 2012 ano
1.686
+0.176
11.65%
1 jan 2013 ano
1.496
-0.19
-11.24%
1 jan 2014 ano
1.187
-0.31
-20.7%
1 jan 2015 ano
1.048
-0.139
-11.7%
Classificação de países por estatísticas atuais por anos


Comentários: