29
/pt/
pt
AIzaSyAYiBZKx7MnpbEhh9jyipgxe19OcubqV5w
April 1, 2024
35151
Heavily indebted poor countries (HIPC)
HPC
false
2
1
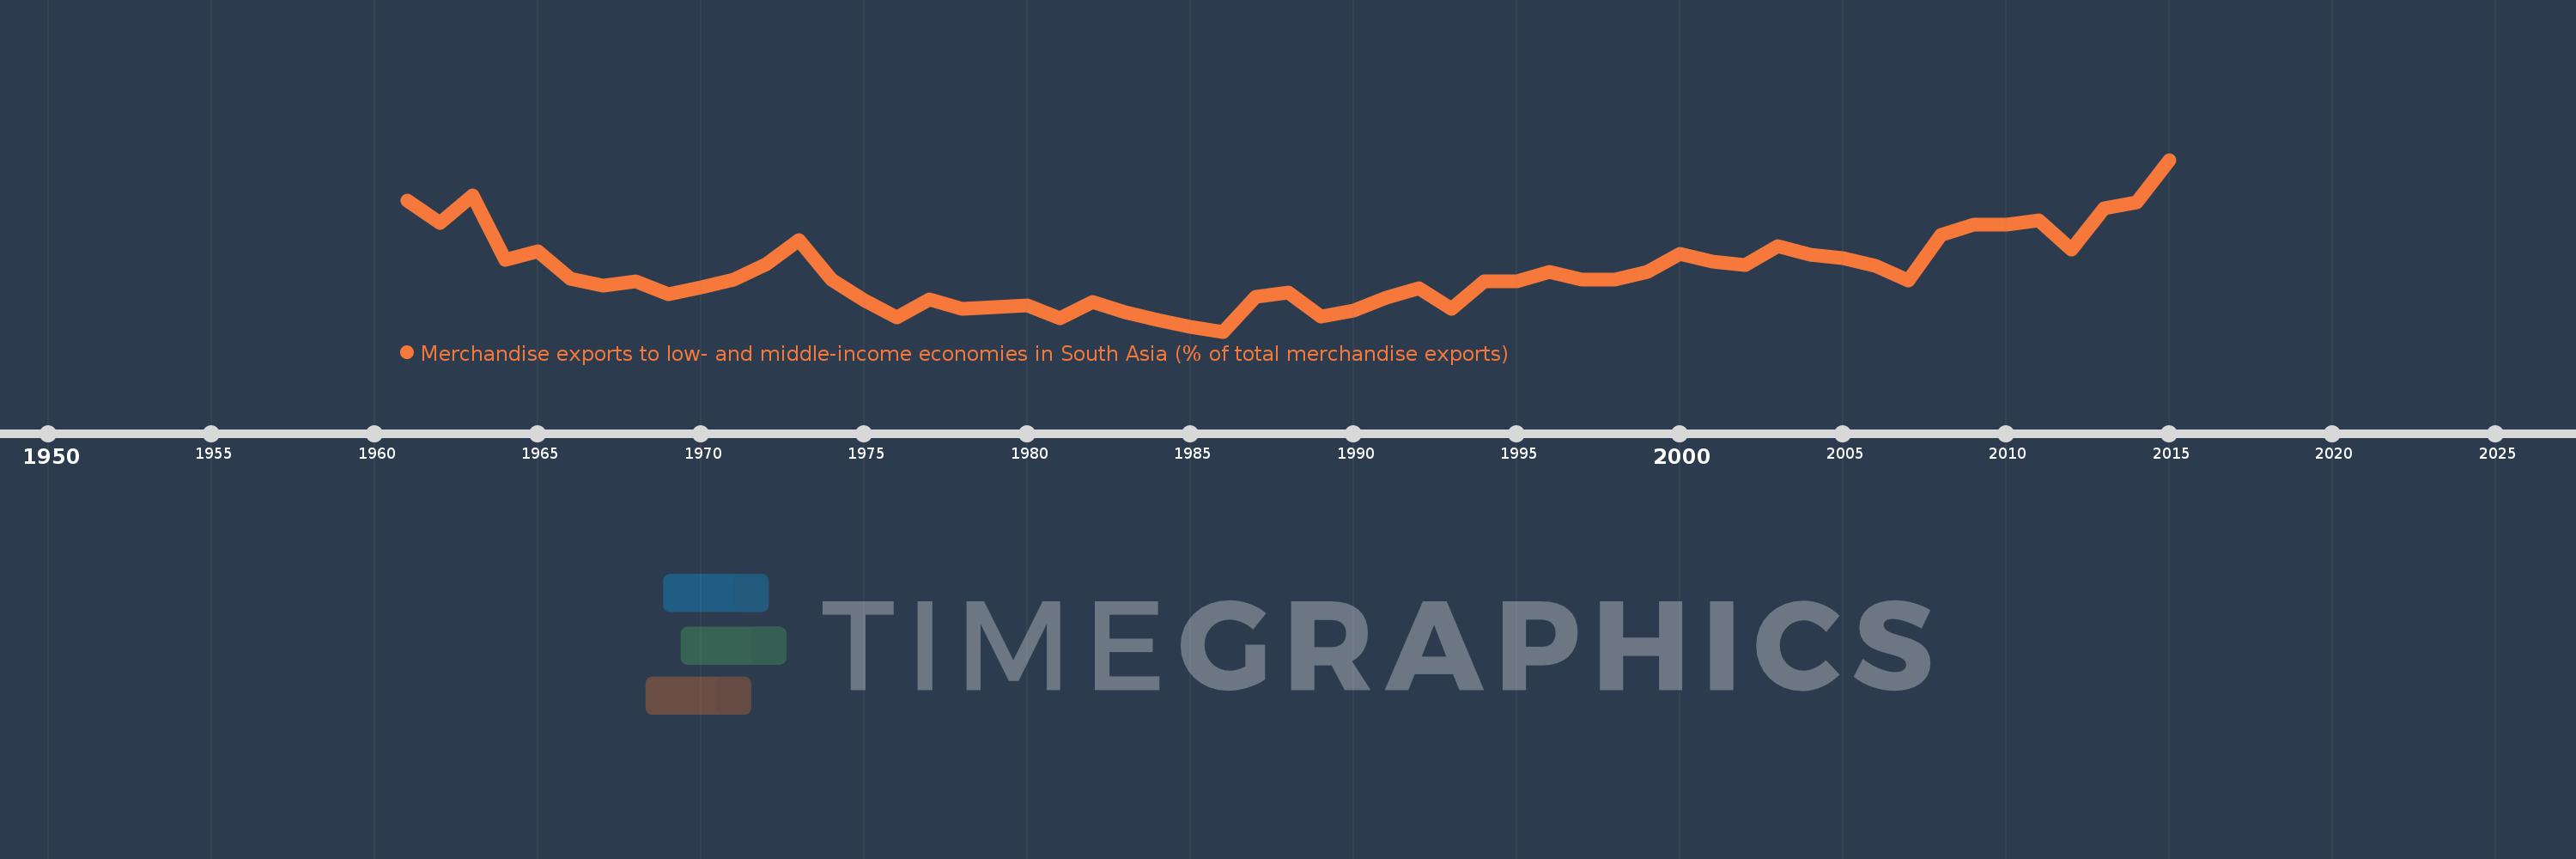
Merchandise exports to low- and middle-income economies in South Asia (% of total merchandise exports)
2015,2014,2013,2012,2011,2010,2009,2008,2007,2006,2005,2004,2003,2002,2001,2000,1999,1998,1997,1996,1995,1994,1993,1992,1991,1990,1989,1988,1987,1986,1985,1984,1983,1982,1981,1980,1979,1978,1977,1976,1975,1974,1973,1972,1971,1970,1969,1968,1967,1966,1965,1964,1963,1962,1961
Estas estatísticas em outros países:
AfghanistanAlbaniaAlgeriaAngolaAntigua and BarbudaArab WorldArgentinaArmeniaArubaAustraliaAustriaAzerbaijanBahamas, TheBahrainBangladeshBarbadosBelarusBelgiumBelizeBeninBermudaBoliviaBrazilBrunei DarussalamBulgariaBurkina FasoBurundiCabo VerdeCambodiaCameroonCanadaCaribbean small statesCentral African RepublicCentral Europe and the BalticsChadChileChinaColombiaCongo, Rep.Costa RicaCote d'IvoireCroatiaCyprusCzech RepublicDenmarkDjiboutiDominicaDominican RepublicEarly-demographic dividendEast Asia & PacificEast Asia & Pacific (excluding high income)East Asia & Pacific (IDA & IBRD countries)EcuadorEgypt, Arab Rep.El SalvadorEstoniaEthiopiaEuro areaEurope & Central AsiaEurope & Central Asia (excluding high income)Europe & Central Asia (IDA & IBRD countries)European UnionFaroe IslandsFijiFinlandFragile and conflict affected situationsFranceGabonGambia, TheGeorgiaGermanyGhanaGibraltarGreeceGreenlandGrenadaGuatemalaGuineaGuyanaHaitiHeavily indebted poor countries (HIPC)High incomeHondurasHong Kong SAR, ChinaHungaryIBRD onlyIcelandIDA & IBRD totalIDA blendIDA onlyIDA totalIndiaIndonesiaIran, Islamic Rep.IraqIrelandIsraelItalyJamaicaJapanJordanKazakhstanKenyaKiribatiKorea, Dem. People’s Rep.Korea, Rep.KosovoKuwaitKyrgyz RepublicLao PDRLate-demographic dividendLatin America & Caribbean Latin America & Caribbean (excluding high income)Latin America & the Caribbean (IDA & IBRD countries)LatviaLeast developed countries: UN classificationLebanonLiberiaLibyaLithuaniaLow & middle incomeLow incomeLower middle incomeLuxembourgMacao SAR, ChinaMacedonia, FYRMadagascarMalawiMalaysiaMaldivesMaliMaltaMauritaniaMauritiusMexicoMiddle East & North AfricaMiddle East & North Africa (excluding high income)Middle East & North Africa (IDA & IBRD countries)Middle incomeMoldovaMongoliaMontenegroMoroccoMozambiqueMyanmarNauruNepalNetherlandsNew CaledoniaNew ZealandNicaraguaNigerNigeriaNorth AmericaNorwayOECD membersOmanOther small statesPacific island small statesPakistanPanamaPapua New GuineaParaguayPeruPhilippinesPolandPortugalPost-demographic dividendPre-demographic dividendQatarRomaniaRussian FederationRwandaSamoaSaudi ArabiaSenegalSerbiaSeychellesSierra LeoneSingaporeSlovak RepublicSloveniaSmall statesSomaliaSouth AfricaSouth AsiaSouth Asia (IDA & IBRD)SpainSri LankaSt. LuciaSt. Vincent and the GrenadinesSub-Saharan Africa Sub-Saharan Africa (excluding high income)Sub-Saharan Africa (IDA & IBRD countries)SudanSurinameSwedenSwitzerlandSyrian Arab RepublicTajikistanTanzaniaThailandTogoTongaTrinidad and TobagoTunisiaTurkeyTurkmenistanUgandaUkraineUnited Arab EmiratesUnited KingdomUnited StatesUpper middle incomeUruguayVanuatuVenezuela, RBVietnamWorldYemen, Rep.ZambiaZimbabwe Linha do tempo:
Nesta escala de tempo está apresentado um gráfico de 1961 ano até 2015 ano Heavily indebted poor countries (HIPC). Dados de 1960 ano ausente. O número de observações reais por data: 55.
Fonte (nome):
Indicadores de desenvolvimento mundial
Fonte (organização):
World Bank staff estimates based data from International Monetary Fund's Direction of Trade database.
Categorias:
Private Sector, Trade
Foi atualizado:
23 abr 2017 ano
Indicadores de alterações dos valores ao longo dos anos
Mínimo:
0.812
1 jan 1986 ano
Máximo:
4.635
1 jan 2015 ano
Na data de observação
Valor
Mudança absoluta
A alteração em relação ao valor anterior
1 jan 1961 ano
3.723
+3.723
0.0%
1 jan 1962 ano
3.231
-0.492
-13.21%
1 jan 1963 ano
3.845
+0.614
19.0%
1 jan 1964 ano
2.402
-1.442
-37.51%
1 jan 1965 ano
2.597
+0.194
8.08%
1 jan 1966 ano
1.983
-0.613
-23.61%
1 jan 1967 ano
1.835
-0.149
-7.5%
1 jan 1968 ano
1.921
+0.086
4.7%
1 jan 1969 ano
1.641
-0.28
-14.57%
1 jan 1970 ano
1.803
+0.162
9.86%
1 jan 1971 ano
1.968
+0.166
9.18%
1 jan 1972 ano
2.322
+0.353
17.95%
1 jan 1973 ano
2.845
+0.524
22.56%
1 jan 1974 ano
1.963
-0.883
-31.03%
1 jan 1975 ano
1.508
-0.454
-23.15%
1 jan 1976 ano
1.128
-0.381
-25.24%
1 jan 1977 ano
1.526
+0.398
35.32%
1 jan 1978 ano
1.316
-0.21
-13.76%
1 jan 1979 ano
1.366
+0.05
3.83%
1 jan 1980 ano
1.393
+0.027
1.94%
1 jan 1981 ano
1.106
-0.287
-20.6%
1 jan 1982 ano
1.472
+0.366
33.08%
1 jan 1983 ano
1.243
-0.229
-15.54%
1 jan 1984 ano
1.066
-0.177
-14.21%
1 jan 1985 ano
0.924
-0.142
-13.35%
1 jan 1986 ano
0.812
-0.112
-12.16%
1 jan 1987 ano
1.589
+0.777
95.8%
1 jan 1988 ano
1.685
+0.096
6.01%
1 jan 1989 ano
1.153
-0.531
-31.54%
1 jan 1990 ano
1.272
+0.119
10.32%
1 jan 1991 ano
1.565
+0.293
23.0%
1 jan 1992 ano
1.786
+0.221
14.11%
1 jan 1993 ano
1.314
-0.472
-26.44%
1 jan 1994 ano
1.939
+0.626
47.63%
1 jan 1995 ano
1.931
-0.008
-0.44%
1 jan 1996 ano
2.136
+0.205
10.64%
1 jan 1997 ano
1.964
-0.172
-8.05%
1 jan 1998 ano
1.978
+0.014
0.71%
1 jan 1999 ano
2.135
+0.157
7.93%
1 jan 2000 ano
2.547
+0.412
19.32%
1 jan 2001 ano
2.367
-0.18
-7.07%
1 jan 2002 ano
2.285
-0.082
-3.48%
1 jan 2003 ano
2.707
+0.422
18.48%
1 jan 2004 ano
2.532
-0.175
-6.45%
1 jan 2005 ano
2.443
-0.089
-3.51%
1 jan 2006 ano
2.271
-0.173
-7.07%
1 jan 2007 ano
1.946
-0.324
-14.28%
1 jan 2008 ano
2.964
+1.017
52.28%
1 jan 2009 ano
3.191
+0.228
7.69%
1 jan 2010 ano
3.188
-0.003
-0.09%
1 jan 2011 ano
3.287
+0.098
3.08%
1 jan 2012 ano
2.638
-0.649
-19.74%
1 jan 2013 ano
3.551
+0.913
34.6%
1 jan 2014 ano
3.693
+0.142
4.0%
1 jan 2015 ano
4.635
+0.942
25.52%
Classificação de países por estatísticas atuais por anos


Comentários: