29
/pt/
pt
AIzaSyAYiBZKx7MnpbEhh9jyipgxe19OcubqV5w
April 1, 2024
139522
Germany
DEU
true
2
1
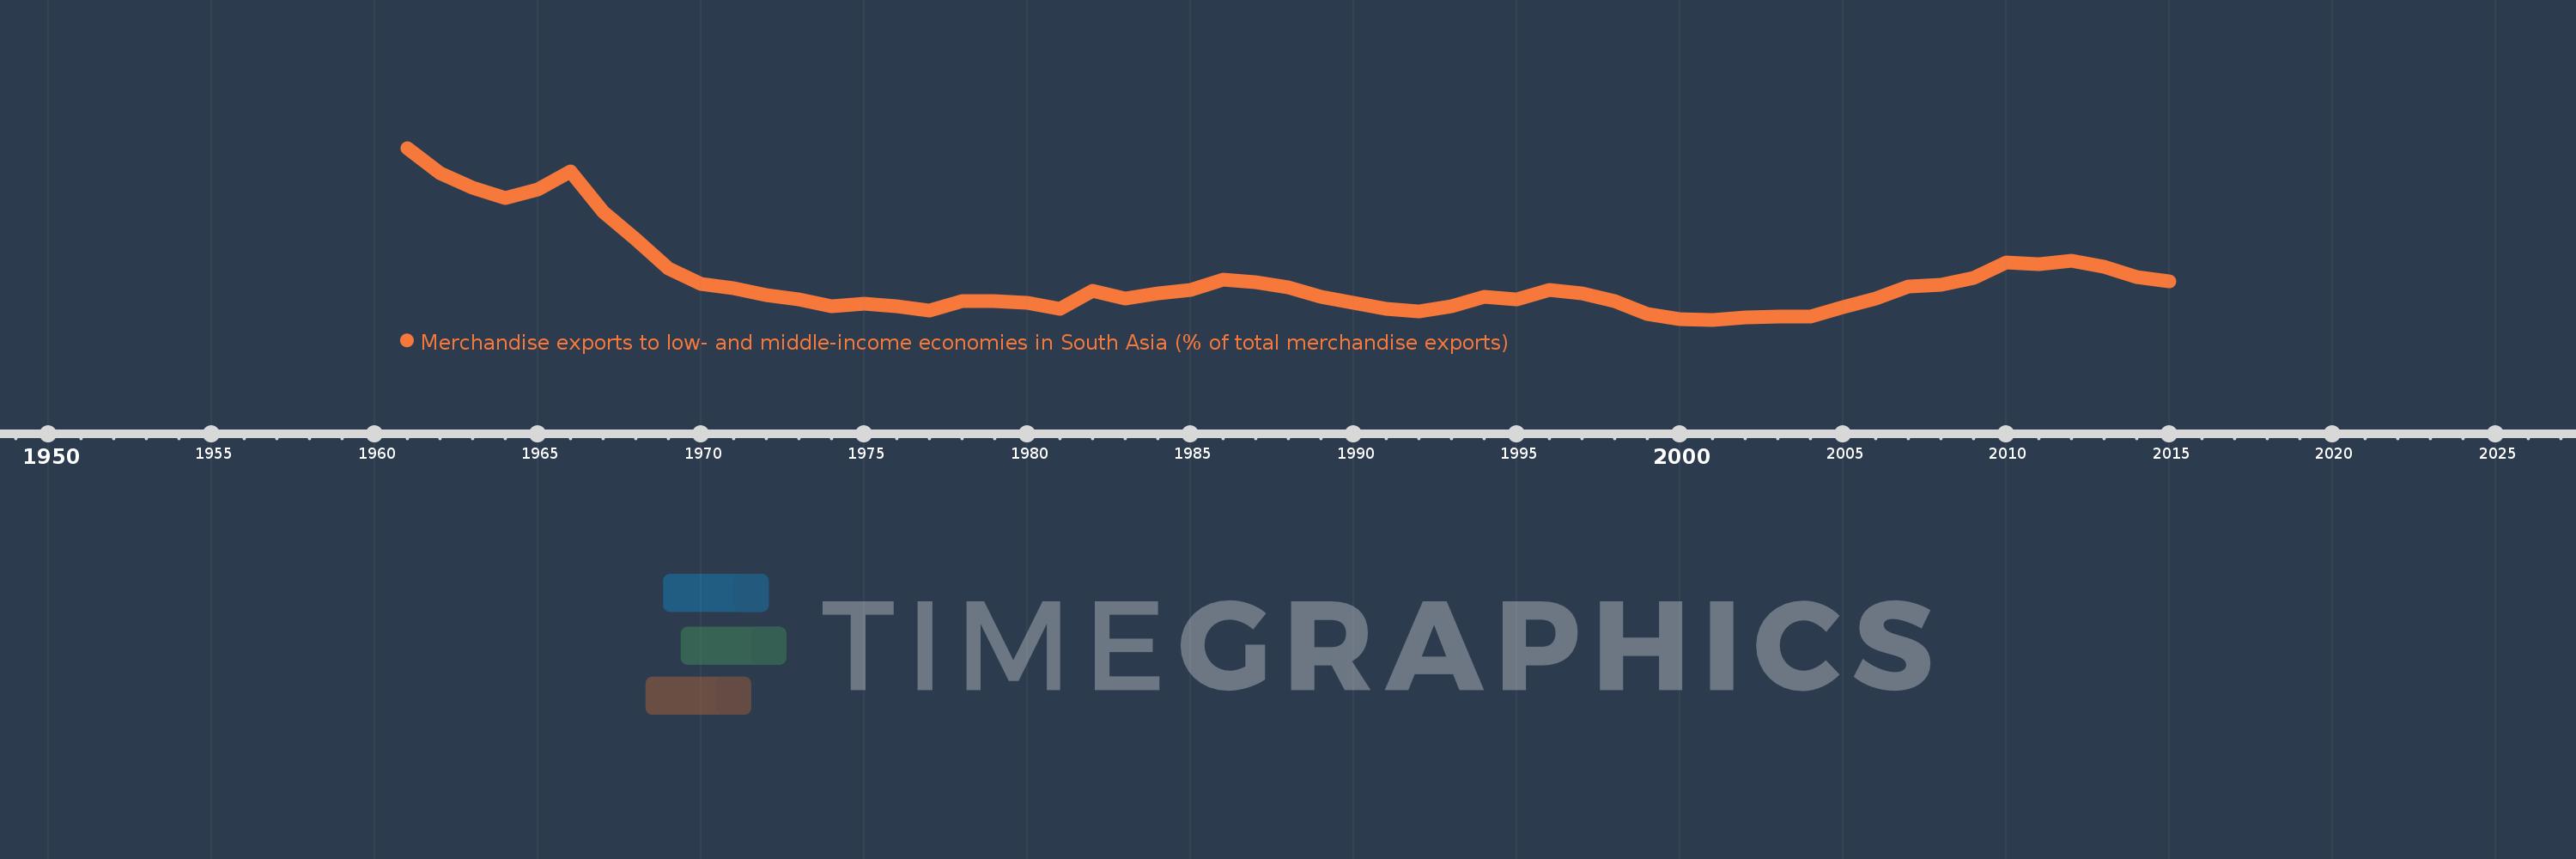
Merchandise exports to low- and middle-income economies in South Asia (% of total merchandise exports)
2015,2014,2013,2012,2011,2010,2009,2008,2007,2006,2005,2004,2003,2002,2001,2000,1999,1998,1997,1996,1995,1994,1993,1992,1991,1990,1989,1988,1987,1986,1985,1984,1983,1982,1981,1980,1979,1978,1977,1976,1975,1974,1973,1972,1971,1970,1969,1968,1967,1966,1965,1964,1963,1962,1961
Estas estatísticas em outros países:
AfghanistanAlbaniaAlgeriaAngolaAntigua and BarbudaArab WorldArgentinaArmeniaArubaAustraliaAustriaAzerbaijanBahamas, TheBahrainBangladeshBarbadosBelarusBelgiumBelizeBeninBermudaBoliviaBrazilBrunei DarussalamBulgariaBurkina FasoBurundiCabo VerdeCambodiaCameroonCanadaCaribbean small statesCentral African RepublicCentral Europe and the BalticsChadChileChinaColombiaCongo, Rep.Costa RicaCote d'IvoireCroatiaCyprusCzech RepublicDenmarkDjiboutiDominicaDominican RepublicEarly-demographic dividendEast Asia & PacificEast Asia & Pacific (excluding high income)East Asia & Pacific (IDA & IBRD countries)EcuadorEgypt, Arab Rep.El SalvadorEstoniaEthiopiaEuro areaEurope & Central AsiaEurope & Central Asia (excluding high income)Europe & Central Asia (IDA & IBRD countries)European UnionFaroe IslandsFijiFinlandFragile and conflict affected situationsFranceGabonGambia, TheGeorgiaGermanyGhanaGibraltarGreeceGreenlandGrenadaGuatemalaGuineaGuyanaHaitiHeavily indebted poor countries (HIPC)High incomeHondurasHong Kong SAR, ChinaHungaryIBRD onlyIcelandIDA & IBRD totalIDA blendIDA onlyIDA totalIndiaIndonesiaIran, Islamic Rep.IraqIrelandIsraelItalyJamaicaJapanJordanKazakhstanKenyaKiribatiKorea, Dem. People’s Rep.Korea, Rep.KosovoKuwaitKyrgyz RepublicLao PDRLate-demographic dividendLatin America & Caribbean Latin America & Caribbean (excluding high income)Latin America & the Caribbean (IDA & IBRD countries)LatviaLeast developed countries: UN classificationLebanonLiberiaLibyaLithuaniaLow & middle incomeLow incomeLower middle incomeLuxembourgMacao SAR, ChinaMacedonia, FYRMadagascarMalawiMalaysiaMaldivesMaliMaltaMauritaniaMauritiusMexicoMiddle East & North AfricaMiddle East & North Africa (excluding high income)Middle East & North Africa (IDA & IBRD countries)Middle incomeMoldovaMongoliaMontenegroMoroccoMozambiqueMyanmarNauruNepalNetherlandsNew CaledoniaNew ZealandNicaraguaNigerNigeriaNorth AmericaNorwayOECD membersOmanOther small statesPacific island small statesPakistanPanamaPapua New GuineaParaguayPeruPhilippinesPolandPortugalPost-demographic dividendPre-demographic dividendQatarRomaniaRussian FederationRwandaSamoaSaudi ArabiaSenegalSerbiaSeychellesSierra LeoneSingaporeSlovak RepublicSloveniaSmall statesSomaliaSouth AfricaSouth AsiaSouth Asia (IDA & IBRD)SpainSri LankaSt. LuciaSt. Vincent and the GrenadinesSub-Saharan Africa Sub-Saharan Africa (excluding high income)Sub-Saharan Africa (IDA & IBRD countries)SudanSurinameSwedenSwitzerlandSyrian Arab RepublicTajikistanTanzaniaThailandTogoTongaTrinidad and TobagoTunisiaTurkeyTurkmenistanUgandaUkraineUnited Arab EmiratesUnited KingdomUnited StatesUpper middle incomeUruguayVanuatuVenezuela, RBVietnamWorldYemen, Rep.ZambiaZimbabwe Linha do tempo:
Nesta escala de tempo está apresentado um gráfico de 1961 ano até 2015 ano Germany. Dados de 1960 ano ausente. O número de observações reais por data: 55.
Fonte (nome):
Indicadores de desenvolvimento mundial
Fonte (organização):
World Bank staff estimates based data from International Monetary Fund's Direction of Trade database.
Categorias:
Private Sector, Trade
Foi atualizado:
23 abr 2017 ano
Indicadores de alterações dos valores ao longo dos anos
Mínimo:
0.483
1 jan 2001 ano
Máximo:
2.574
1 jan 1961 ano
Na data de observação
Valor
Mudança absoluta
A alteração em relação ao valor anterior
1 jan 1961 ano
2.574
+2.574
0.0%
1 jan 1962 ano
2.269
-0.306
-11.87%
1 jan 1963 ano
2.093
-0.176
-7.75%
1 jan 1964 ano
1.968
-0.125
-5.99%
1 jan 1965 ano
2.065
+0.097
4.94%
1 jan 1966 ano
2.29
+0.226
10.93%
1 jan 1967 ano
1.797
-0.494
-21.55%
1 jan 1968 ano
1.467
-0.33
-18.38%
1 jan 1969 ano
1.105
-0.361
-24.65%
1 jan 1970 ano
0.921
-0.185
-16.7%
1 jan 1971 ano
0.868
-0.053
-5.74%
1 jan 1972 ano
0.78
-0.087
-10.08%
1 jan 1973 ano
0.732
-0.048
-6.2%
1 jan 1974 ano
0.648
-0.084
-11.46%
1 jan 1975 ano
0.68
+0.032
5.01%
1 jan 1976 ano
0.642
-0.039
-5.72%
1 jan 1977 ano
0.599
-0.042
-6.55%
1 jan 1978 ano
0.712
+0.113
18.85%
1 jan 1979 ano
0.708
-0.004
-0.61%
1 jan 1980 ano
0.69
-0.018
-2.61%
1 jan 1981 ano
0.612
-0.077
-11.22%
1 jan 1982 ano
0.839
+0.227
37.08%
1 jan 1983 ano
0.744
-0.096
-11.41%
1 jan 1984 ano
0.801
+0.057
7.71%
1 jan 1985 ano
0.844
+0.043
5.35%
1 jan 1986 ano
0.969
+0.125
14.83%
1 jan 1987 ano
0.94
-0.029
-2.97%
1 jan 1988 ano
0.873
-0.067
-7.14%
1 jan 1989 ano
0.763
-0.11
-12.64%
1 jan 1990 ano
0.691
-0.072
-9.44%
1 jan 1991 ano
0.62
-0.071
-10.22%
1 jan 1992 ano
0.58
-0.04
-6.49%
1 jan 1993 ano
0.651
+0.071
12.27%
1 jan 1994 ano
0.765
+0.114
17.51%
1 jan 1995 ano
0.736
-0.029
-3.81%
1 jan 1996 ano
0.848
+0.112
15.2%
1 jan 1997 ano
0.803
-0.045
-5.3%
1 jan 1998 ano
0.713
-0.09
-11.2%
1 jan 1999 ano
0.556
-0.157
-22.06%
1 jan 2000 ano
0.494
-0.061
-11.06%
1 jan 2001 ano
0.483
-0.011
-2.28%
1 jan 2002 ano
0.507
+0.024
4.99%
1 jan 2003 ano
0.521
+0.014
2.81%
1 jan 2004 ano
0.52
-0.001
-0.25%
1 jan 2005 ano
0.632
+0.112
21.58%
1 jan 2006 ano
0.737
+0.105
16.65%
1 jan 2007 ano
0.886
+0.149
20.2%
1 jan 2008 ano
0.912
+0.026
2.95%
1 jan 2009 ano
0.989
+0.076
8.35%
1 jan 2010 ano
1.185
+0.197
19.91%
1 jan 2011 ano
1.158
-0.028
-2.32%
1 jan 2012 ano
1.197
+0.039
3.38%
1 jan 2013 ano
1.124
-0.073
-6.12%
1 jan 2014 ano
1.004
-0.12
-10.66%
1 jan 2015 ano
0.947
-0.056
-5.61%
Classificação de países por estatísticas atuais por anos


Comentários: