29
/pt/
pt
AIzaSyAYiBZKx7MnpbEhh9jyipgxe19OcubqV5w
April 1, 2024
43963
Latin America & the Caribbean (IDA & IBRD countries)
TLA
false
2
1
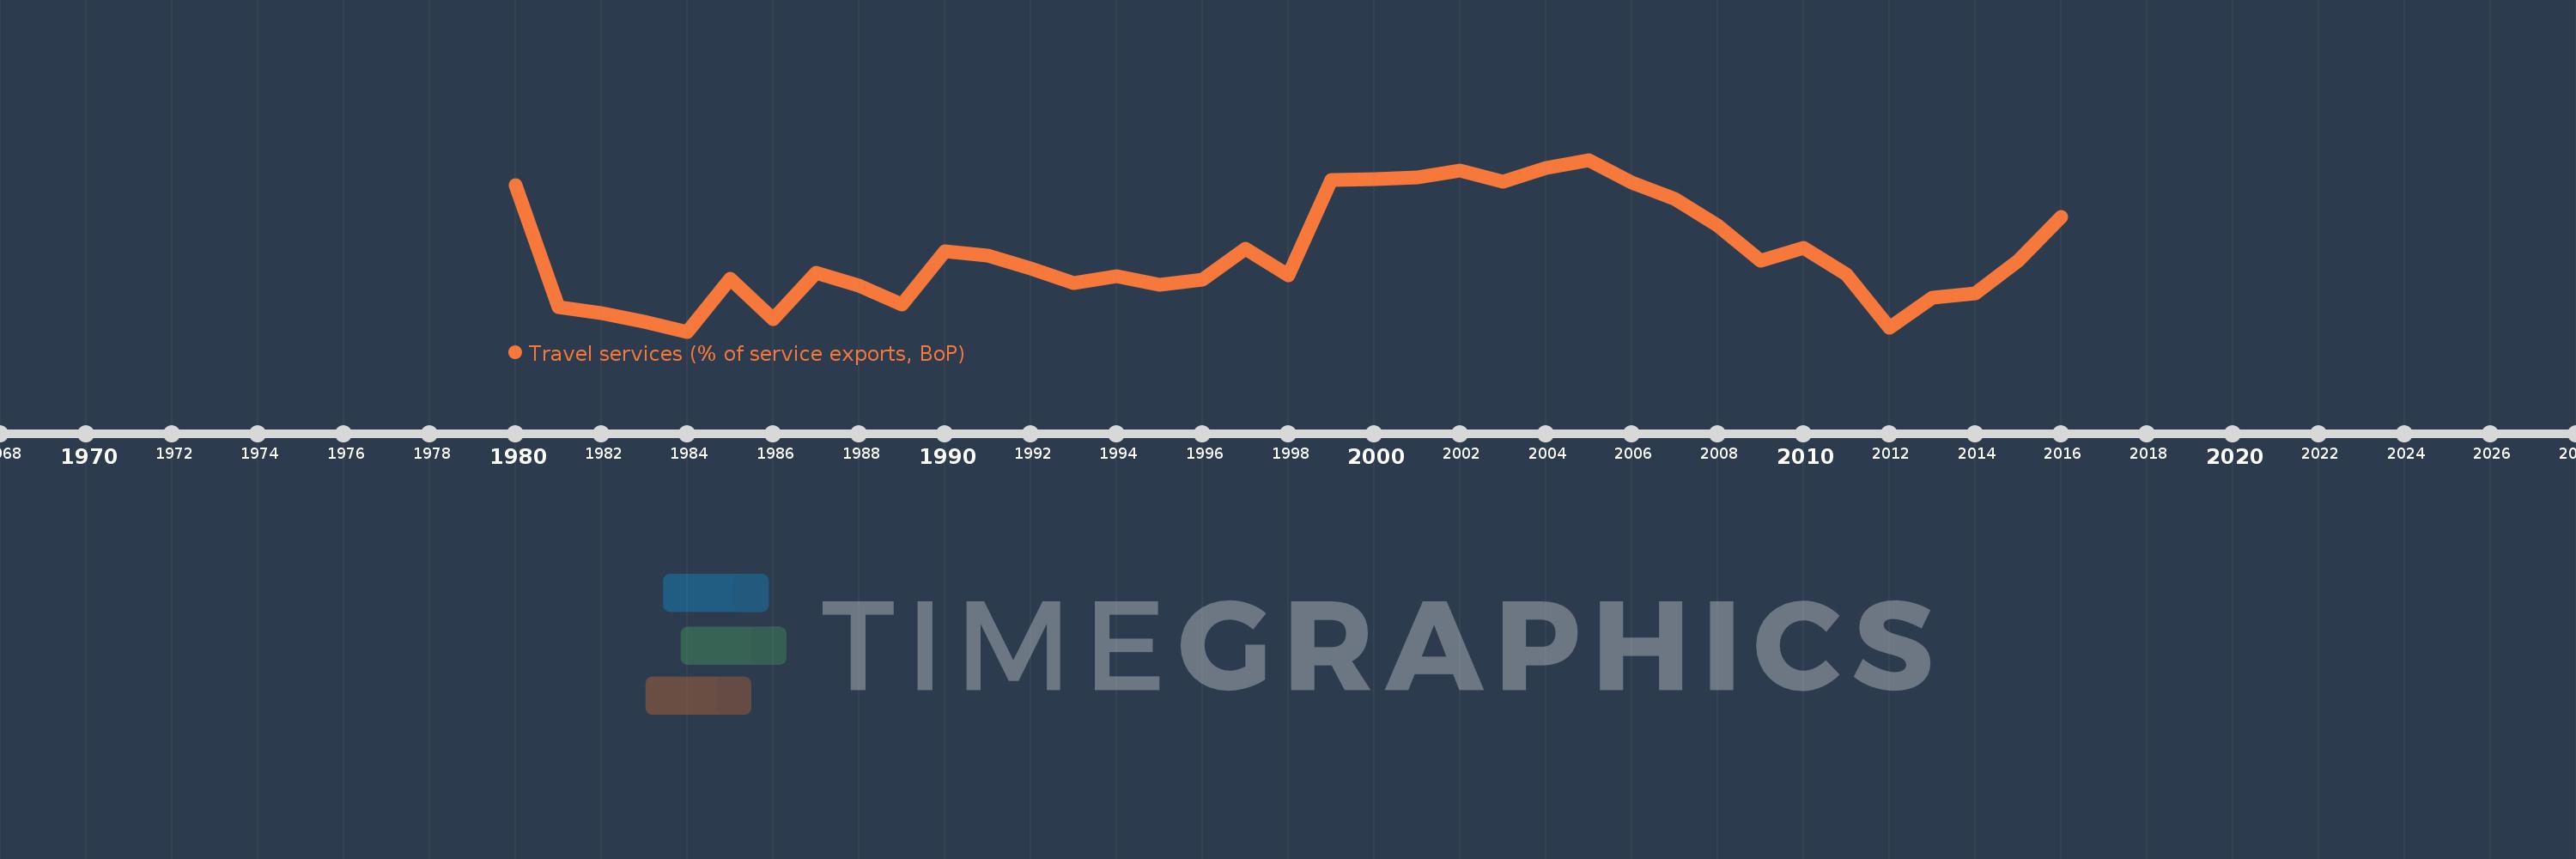
Travel services (% of service exports, BoP)
2016,2015,2014,2013,2012,2011,2010,2009,2008,2007,2006,2005,2004,2003,2002,2001,2000,1999,1998,1997,1996,1995,1994,1993,1992,1991,1990,1989,1988,1987,1986,1985,1984,1983,1982,1981,1980
Estas estatísticas em outros países:
AfghanistanAlbaniaAlgeriaAngolaAntigua and BarbudaArab WorldArgentinaArmeniaArubaAustraliaAustriaAzerbaijanBahamas, TheBahrainBangladeshBarbadosBelarusBelgiumBelizeBeninBermudaBhutanBoliviaBosnia and HerzegovinaBotswanaBrazilBrunei DarussalamBulgariaBurkina FasoBurundiCabo VerdeCambodiaCameroonCanadaCaribbean small statesCentral African RepublicCentral Europe and the BalticsChadChileChinaColombiaComorosCongo, Dem. Rep.Congo, Rep.Costa RicaCote d'IvoireCroatiaCuracaoCyprusCzech RepublicDenmarkDjiboutiDominicaDominican RepublicEarly-demographic dividendEast Asia & PacificEast Asia & Pacific (excluding high income)East Asia & Pacific (IDA & IBRD countries)EcuadorEgypt, Arab Rep.El SalvadorEritreaEstoniaEthiopiaEuro areaEurope & Central AsiaEurope & Central Asia (excluding high income)Europe & Central Asia (IDA & IBRD countries)European UnionFaroe IslandsFijiFinlandFragile and conflict affected situationsFranceFrench PolynesiaGabonGambia, TheGeorgiaGermanyGhanaGreeceGrenadaGuatemalaGuineaGuinea-BissauGuyanaHaitiHeavily indebted poor countries (HIPC)High incomeHondurasHong Kong SAR, ChinaHungaryIBRD onlyIcelandIDA & IBRD totalIDA onlyIDA totalIndiaIndonesiaIran, Islamic Rep.IraqIrelandIsraelItalyJamaicaJapanJordanKazakhstanKenyaKiribatiKorea, Rep.KosovoKuwaitKyrgyz RepublicLao PDRLate-demographic dividendLatin America & Caribbean Latin America & Caribbean (excluding high income)Latin America & the Caribbean (IDA & IBRD countries)LatviaLeast developed countries: UN classificationLebanonLesothoLiberiaLibyaLithuaniaLow & middle incomeLow incomeLower middle incomeLuxembourgMacao SAR, ChinaMacedonia, FYRMadagascarMalawiMalaysiaMaldivesMaliMaltaMarshall IslandsMauritaniaMauritiusMexicoMicronesia, Fed. Sts.Middle East & North Africa (excluding high income)Middle East & North Africa (IDA & IBRD countries)Middle incomeMoldovaMongoliaMontenegroMoroccoMozambiqueMyanmarNamibiaNepalNetherlandsNew CaledoniaNew ZealandNicaraguaNigerNigeriaNorth AmericaNorwayOECD membersOmanOther small statesPacific island small statesPakistanPalauPanamaPapua New GuineaParaguayPeruPhilippinesPolandPortugalPost-demographic dividendPre-demographic dividendQatarRomaniaRussian FederationRwandaSamoaSao Tome and PrincipeSaudi ArabiaSenegalSerbiaSeychellesSierra LeoneSingaporeSint Maarten (Dutch part)Slovak RepublicSloveniaSmall statesSolomon IslandsSouth AfricaSouth AsiaSouth Asia (IDA & IBRD)South SudanSpainSri LankaSt. Kitts and NevisSt. LuciaSt. Vincent and the GrenadinesSub-Saharan Africa Sub-Saharan Africa (excluding high income)Sub-Saharan Africa (IDA & IBRD countries)SudanSurinameSwazilandSwedenSwitzerlandSyrian Arab RepublicTajikistanTanzaniaThailandTimor-LesteTogoTongaTrinidad and TobagoTunisiaTurkeyTuvaluUgandaUkraineUnited KingdomUnited StatesUpper middle incomeUruguayVanuatuVenezuela, RBWest Bank and GazaWorldYemen, Rep.ZambiaZimbabwe Linha do tempo:
Nesta escala de tempo está apresentado um gráfico de 1980 ano até 2016 ano Latin America & the Caribbean (IDA & IBRD countries). Dados de 1979 ano ausente. O número de observações reais por data: 37.
Fonte (nome):
Indicadores de desenvolvimento mundial
Fonte (organização):
International Monetary Fund, Balance of Payments Statistics Yearbook and data files.
Categorias:
Economy & Growth, Trade
Foi atualizado:
23 abr 2017 ano
Indicadores de alterações dos valores ao longo dos anos
Mínimo:
37.123
1 jan 1984 ano
Máximo:
47.911
1 jan 2005 ano
Na data de observação
Valor
Mudança absoluta
A alteração em relação ao valor anterior
1 jan 1980 ano
46.341
+46.341
0.0%
1 jan 1981 ano
38.638
-7.703
-16.62%
1 jan 1982 ano
38.303
-0.334
-0.87%
1 jan 1983 ano
37.757
-0.547
-1.43%
1 jan 1984 ano
37.123
-0.634
-1.68%
1 jan 1985 ano
40.438
+3.316
8.93%
1 jan 1986 ano
37.89
-2.548
-6.3%
1 jan 1987 ano
40.835
+2.945
7.77%
1 jan 1988 ano
39.99
-0.845
-2.07%
1 jan 1989 ano
38.8
-1.19
-2.98%
1 jan 1990 ano
42.152
+3.352
8.64%
1 jan 1991 ano
41.917
-0.235
-0.56%
1 jan 1992 ano
41.063
-0.854
-2.04%
1 jan 1993 ano
40.165
-0.898
-2.19%
1 jan 1994 ano
40.616
+0.451
1.12%
1 jan 1995 ano
40.083
-0.533
-1.31%
1 jan 1996 ano
40.385
+0.302
0.75%
1 jan 1997 ano
42.339
+1.954
4.84%
1 jan 1998 ano
40.659
-1.68
-3.97%
1 jan 1999 ano
46.646
+5.987
14.72%
1 jan 2000 ano
46.688
+0.042
0.09%
1 jan 2001 ano
46.824
+0.136
0.29%
1 jan 2002 ano
47.244
+0.42
0.9%
1 jan 2003 ano
46.548
-0.696
-1.47%
1 jan 2004 ano
47.416
+0.868
1.87%
1 jan 2005 ano
47.911
+0.495
1.04%
1 jan 2006 ano
46.48
-1.432
-2.99%
1 jan 2007 ano
45.481
-0.999
-2.15%
1 jan 2008 ano
43.761
-1.72
-3.78%
1 jan 2009 ano
41.564
-2.197
-5.02%
1 jan 2010 ano
42.362
+0.798
1.92%
1 jan 2011 ano
40.713
-1.649
-3.89%
1 jan 2012 ano
37.392
-3.321
-8.16%
1 jan 2013 ano
39.258
+1.866
4.99%
1 jan 2014 ano
39.529
+0.271
0.69%
1 jan 2015 ano
41.548
+2.018
5.11%
1 jan 2016 ano
44.321
+2.773
6.67%
Classificação de países por estatísticas atuais por anos


Comentários: