29
/pt/
pt
AIzaSyAYiBZKx7MnpbEhh9jyipgxe19OcubqV5w
April 1, 2024
108116
Colombia
COL
true
2
1
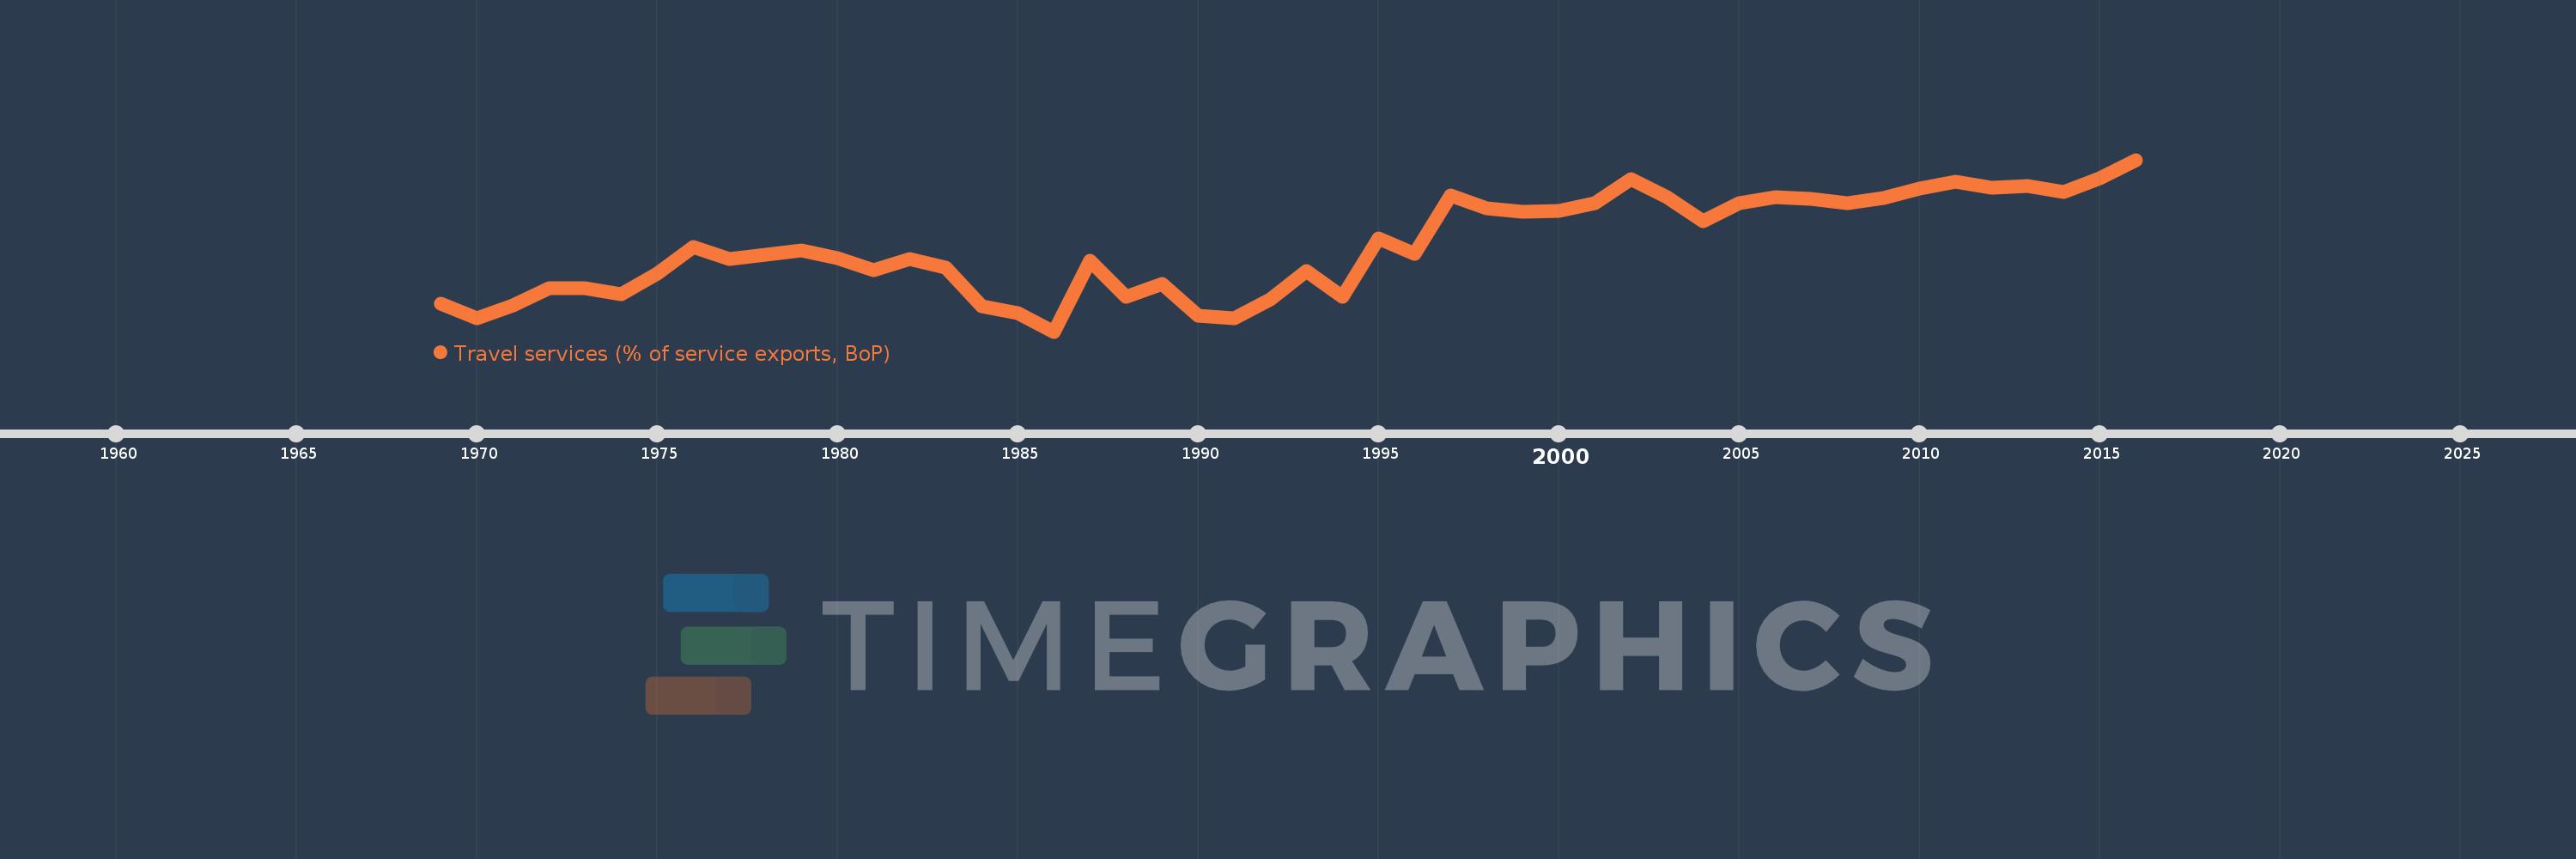
Travel services (% of service exports, BoP)
2016,2015,2014,2013,2012,2011,2010,2009,2008,2007,2006,2005,2004,2003,2002,2001,2000,1999,1998,1997,1996,1995,1994,1993,1992,1991,1990,1989,1988,1987,1986,1985,1984,1983,1982,1981,1980,1979,1978,1977,1976,1975,1974,1973,1972,1971,1970,1969
Estas estatísticas em outros países:
AfghanistanAlbaniaAlgeriaAngolaAntigua and BarbudaArab WorldArgentinaArmeniaArubaAustraliaAustriaAzerbaijanBahamas, TheBahrainBangladeshBarbadosBelarusBelgiumBelizeBeninBermudaBhutanBoliviaBosnia and HerzegovinaBotswanaBrazilBrunei DarussalamBulgariaBurkina FasoBurundiCabo VerdeCambodiaCameroonCanadaCaribbean small statesCentral African RepublicCentral Europe and the BalticsChadChileChinaColombiaComorosCongo, Dem. Rep.Congo, Rep.Costa RicaCote d'IvoireCroatiaCuracaoCyprusCzech RepublicDenmarkDjiboutiDominicaDominican RepublicEarly-demographic dividendEast Asia & PacificEast Asia & Pacific (excluding high income)East Asia & Pacific (IDA & IBRD countries)EcuadorEgypt, Arab Rep.El SalvadorEritreaEstoniaEthiopiaEuro areaEurope & Central AsiaEurope & Central Asia (excluding high income)Europe & Central Asia (IDA & IBRD countries)European UnionFaroe IslandsFijiFinlandFragile and conflict affected situationsFranceFrench PolynesiaGabonGambia, TheGeorgiaGermanyGhanaGreeceGrenadaGuatemalaGuineaGuinea-BissauGuyanaHaitiHeavily indebted poor countries (HIPC)High incomeHondurasHong Kong SAR, ChinaHungaryIBRD onlyIcelandIDA & IBRD totalIDA onlyIDA totalIndiaIndonesiaIran, Islamic Rep.IraqIrelandIsraelItalyJamaicaJapanJordanKazakhstanKenyaKiribatiKorea, Rep.KosovoKuwaitKyrgyz RepublicLao PDRLate-demographic dividendLatin America & Caribbean Latin America & Caribbean (excluding high income)Latin America & the Caribbean (IDA & IBRD countries)LatviaLeast developed countries: UN classificationLebanonLesothoLiberiaLibyaLithuaniaLow & middle incomeLow incomeLower middle incomeLuxembourgMacao SAR, ChinaMacedonia, FYRMadagascarMalawiMalaysiaMaldivesMaliMaltaMarshall IslandsMauritaniaMauritiusMexicoMicronesia, Fed. Sts.Middle East & North Africa (excluding high income)Middle East & North Africa (IDA & IBRD countries)Middle incomeMoldovaMongoliaMontenegroMoroccoMozambiqueMyanmarNamibiaNepalNetherlandsNew CaledoniaNew ZealandNicaraguaNigerNigeriaNorth AmericaNorwayOECD membersOmanOther small statesPacific island small statesPakistanPalauPanamaPapua New GuineaParaguayPeruPhilippinesPolandPortugalPost-demographic dividendPre-demographic dividendQatarRomaniaRussian FederationRwandaSamoaSao Tome and PrincipeSaudi ArabiaSenegalSerbiaSeychellesSierra LeoneSingaporeSint Maarten (Dutch part)Slovak RepublicSloveniaSmall statesSolomon IslandsSouth AfricaSouth AsiaSouth Asia (IDA & IBRD)South SudanSpainSri LankaSt. Kitts and NevisSt. LuciaSt. Vincent and the GrenadinesSub-Saharan Africa Sub-Saharan Africa (excluding high income)Sub-Saharan Africa (IDA & IBRD countries)SudanSurinameSwazilandSwedenSwitzerlandSyrian Arab RepublicTajikistanTanzaniaThailandTimor-LesteTogoTongaTrinidad and TobagoTunisiaTurkeyTuvaluUgandaUkraineUnited KingdomUnited StatesUpper middle incomeUruguayVanuatuVenezuela, RBWest Bank and GazaWorldYemen, Rep.ZambiaZimbabwe Linha do tempo:
Nesta escala de tempo está apresentado um gráfico de 1969 ano até 2016 ano Colombia. Dados de 1968 ano ausente. O número de observações reais por data: 48.
Fonte (nome):
Indicadores de desenvolvimento mundial
Fonte (organização):
International Monetary Fund, Balance of Payments Statistics Yearbook and data files.
Categorias:
Economy & Growth, Trade
Foi atualizado:
23 abr 2017 ano
Indicadores de alterações dos valores ao longo dos anos
Mínimo:
22.456
1 jan 1986 ano
Máximo:
59.423
1 jan 2016 ano
Na data de observação
Valor
Mudança absoluta
A alteração em relação ao valor anterior
1 jan 1969 ano
28.481
+28.481
0.0%
1 jan 1970 ano
25.281
-3.2
-11.24%
1 jan 1971 ano
28.125
+2.844
11.25%
1 jan 1972 ano
31.797
+3.672
13.06%
1 jan 1973 ano
31.731
-0.066
-0.21%
1 jan 1974 ano
30.508
-1.222
-3.85%
1 jan 1975 ano
34.868
+4.36
14.29%
1 jan 1976 ano
40.585
+5.716
16.39%
1 jan 1977 ano
38.043
-2.542
-6.26%
1 jan 1978 ano
38.907
+0.864
2.27%
1 jan 1979 ano
39.891
+0.984
2.53%
1 jan 1980 ano
38.281
-1.61
-4.03%
1 jan 1981 ano
35.619
-2.663
-6.96%
1 jan 1982 ano
38.054
+2.435
6.84%
1 jan 1983 ano
36.252
-1.802
-4.74%
1 jan 1984 ano
27.844
-8.408
-23.19%
1 jan 1985 ano
26.429
-1.414
-5.08%
1 jan 1986 ano
22.456
-3.973
-15.03%
1 jan 1987 ano
37.726
+15.269
68.0%
1 jan 1988 ano
29.931
-7.794
-20.66%
1 jan 1989 ano
32.741
+2.81
9.39%
1 jan 1990 ano
25.949
-6.793
-20.75%
1 jan 1991 ano
25.375
-0.574
-2.21%
1 jan 1992 ano
29.379
+4.004
15.78%
1 jan 1993 ano
35.569
+6.191
21.07%
1 jan 1994 ano
29.965
-5.604
-15.75%
1 jan 1995 ano
42.524
+12.559
41.91%
1 jan 1996 ano
39.151
-3.373
-7.93%
1 jan 1997 ano
51.668
+12.517
31.97%
1 jan 1998 ano
49.049
-2.619
-5.07%
1 jan 1999 ano
48.286
-0.763
-1.56%
1 jan 2000 ano
48.46
+0.174
0.36%
1 jan 2001 ano
50.009
+1.549
3.2%
1 jan 2002 ano
55.277
+5.268
10.53%
1 jan 2003 ano
51.445
-3.833
-6.93%
1 jan 2004 ano
46.158
-5.286
-10.28%
1 jan 2005 ano
50.023
+3.865
8.37%
1 jan 2006 ano
51.392
+1.369
2.74%
1 jan 2007 ano
51.058
-0.334
-0.65%
1 jan 2008 ano
50.121
-0.937
-1.83%
1 jan 2009 ano
51.181
+1.059
2.11%
1 jan 2010 ano
53.255
+2.074
4.05%
1 jan 2011 ano
54.696
+1.441
2.71%
1 jan 2012 ano
53.407
-1.29
-2.36%
1 jan 2013 ano
53.813
+0.406
0.76%
1 jan 2014 ano
52.559
-1.254
-2.33%
1 jan 2015 ano
55.436
+2.878
5.48%
1 jan 2016 ano
59.423
+3.987
7.19%
Classificação de países por estatísticas atuais por anos


Comentários: