29
/pt/
pt
AIzaSyAYiBZKx7MnpbEhh9jyipgxe19OcubqV5w
April 1, 2024
125654
Egypt, Arab Rep.
EGY
true
2
1
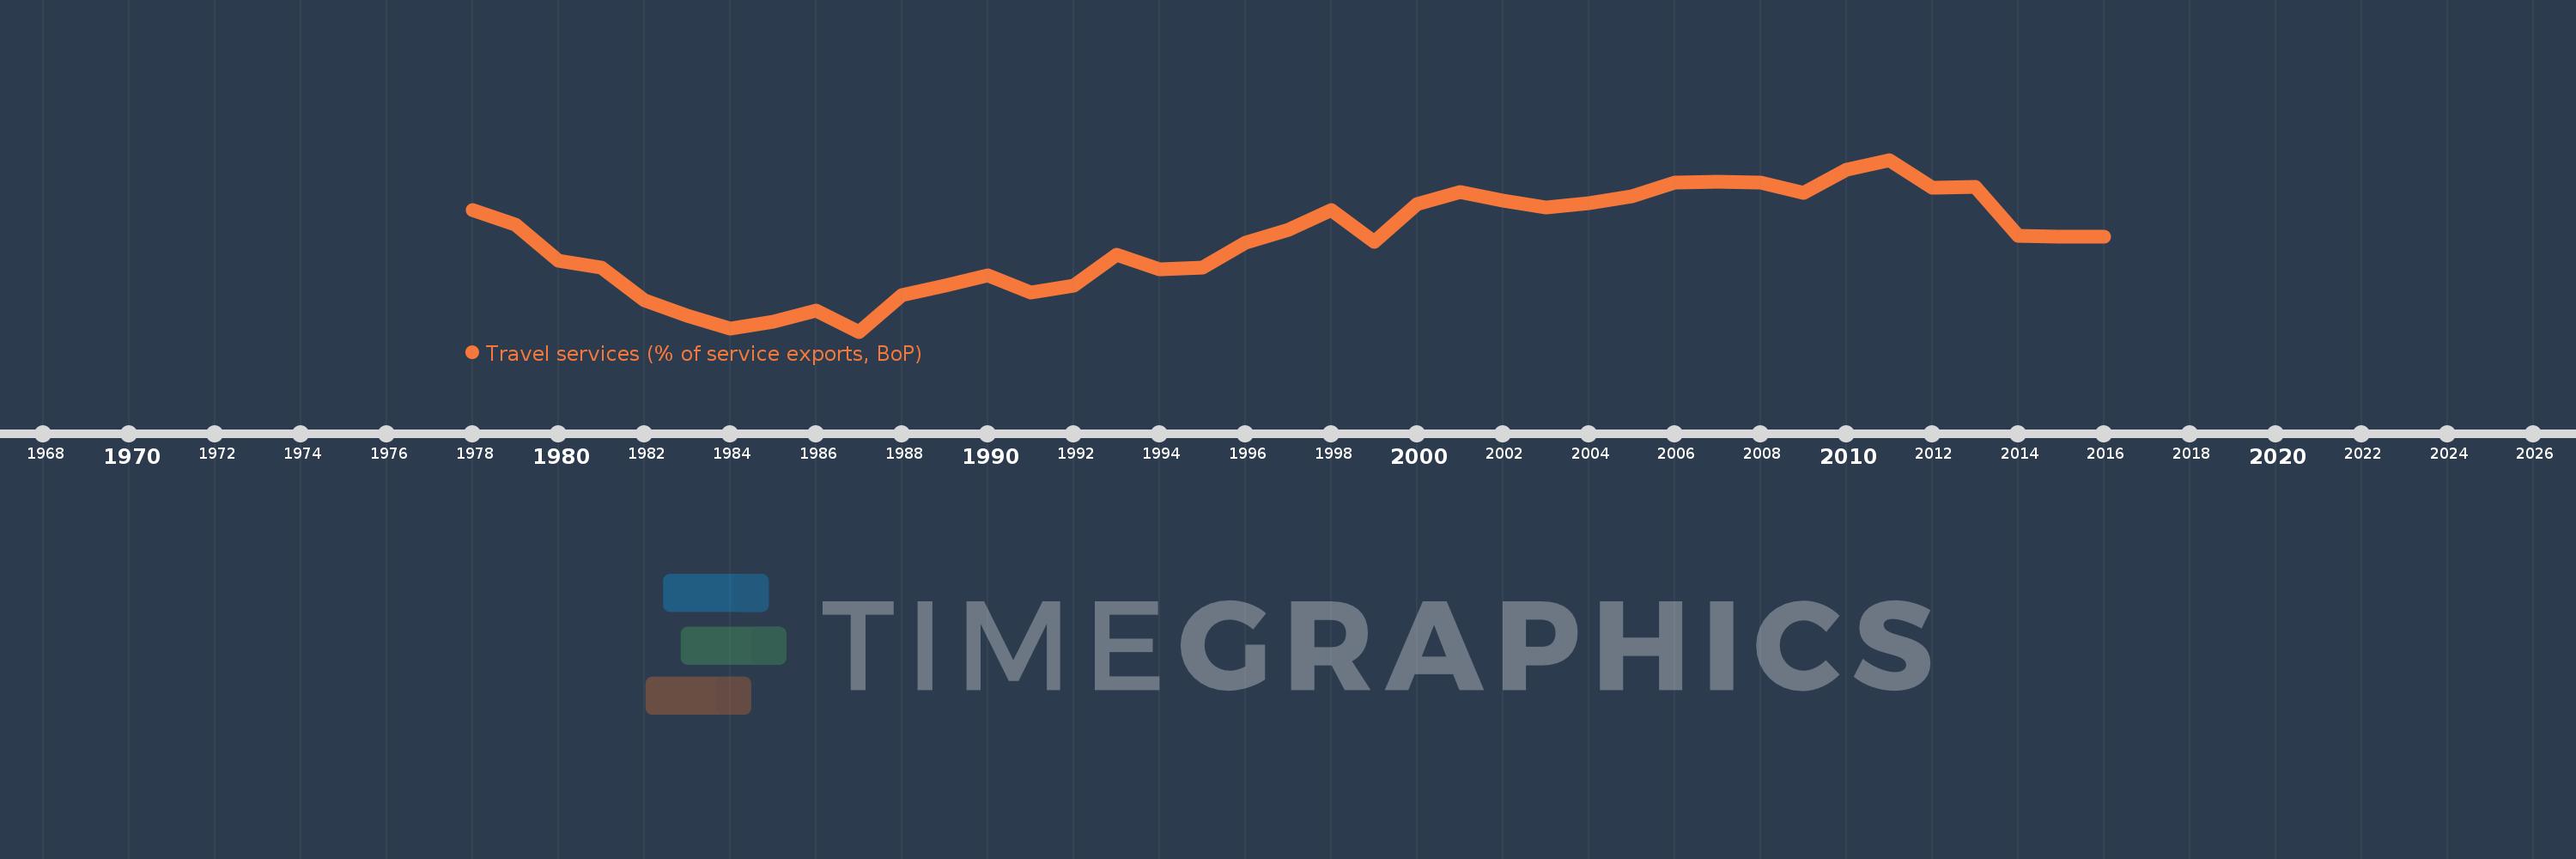
Travel services (% of service exports, BoP)
2016,2015,2014,2013,2012,2011,2010,2009,2008,2007,2006,2005,2004,2003,2002,2001,2000,1999,1998,1997,1996,1995,1994,1993,1992,1991,1990,1989,1988,1987,1986,1985,1984,1983,1982,1981,1980,1979,1978
Estas estatísticas em outros países:
AfghanistanAlbaniaAlgeriaAngolaAntigua and BarbudaArab WorldArgentinaArmeniaArubaAustraliaAustriaAzerbaijanBahamas, TheBahrainBangladeshBarbadosBelarusBelgiumBelizeBeninBermudaBhutanBoliviaBosnia and HerzegovinaBotswanaBrazilBrunei DarussalamBulgariaBurkina FasoBurundiCabo VerdeCambodiaCameroonCanadaCaribbean small statesCentral African RepublicCentral Europe and the BalticsChadChileChinaColombiaComorosCongo, Dem. Rep.Congo, Rep.Costa RicaCote d'IvoireCroatiaCuracaoCyprusCzech RepublicDenmarkDjiboutiDominicaDominican RepublicEarly-demographic dividendEast Asia & PacificEast Asia & Pacific (excluding high income)East Asia & Pacific (IDA & IBRD countries)EcuadorEgypt, Arab Rep.El SalvadorEritreaEstoniaEthiopiaEuro areaEurope & Central AsiaEurope & Central Asia (excluding high income)Europe & Central Asia (IDA & IBRD countries)European UnionFaroe IslandsFijiFinlandFragile and conflict affected situationsFranceFrench PolynesiaGabonGambia, TheGeorgiaGermanyGhanaGreeceGrenadaGuatemalaGuineaGuinea-BissauGuyanaHaitiHeavily indebted poor countries (HIPC)High incomeHondurasHong Kong SAR, ChinaHungaryIBRD onlyIcelandIDA & IBRD totalIDA onlyIDA totalIndiaIndonesiaIran, Islamic Rep.IraqIrelandIsraelItalyJamaicaJapanJordanKazakhstanKenyaKiribatiKorea, Rep.KosovoKuwaitKyrgyz RepublicLao PDRLate-demographic dividendLatin America & Caribbean Latin America & Caribbean (excluding high income)Latin America & the Caribbean (IDA & IBRD countries)LatviaLeast developed countries: UN classificationLebanonLesothoLiberiaLibyaLithuaniaLow & middle incomeLow incomeLower middle incomeLuxembourgMacao SAR, ChinaMacedonia, FYRMadagascarMalawiMalaysiaMaldivesMaliMaltaMarshall IslandsMauritaniaMauritiusMexicoMicronesia, Fed. Sts.Middle East & North Africa (excluding high income)Middle East & North Africa (IDA & IBRD countries)Middle incomeMoldovaMongoliaMontenegroMoroccoMozambiqueMyanmarNamibiaNepalNetherlandsNew CaledoniaNew ZealandNicaraguaNigerNigeriaNorth AmericaNorwayOECD membersOmanOther small statesPacific island small statesPakistanPalauPanamaPapua New GuineaParaguayPeruPhilippinesPolandPortugalPost-demographic dividendPre-demographic dividendQatarRomaniaRussian FederationRwandaSamoaSao Tome and PrincipeSaudi ArabiaSenegalSerbiaSeychellesSierra LeoneSingaporeSint Maarten (Dutch part)Slovak RepublicSloveniaSmall statesSolomon IslandsSouth AfricaSouth AsiaSouth Asia (IDA & IBRD)South SudanSpainSri LankaSt. Kitts and NevisSt. LuciaSt. Vincent and the GrenadinesSub-Saharan Africa Sub-Saharan Africa (excluding high income)Sub-Saharan Africa (IDA & IBRD countries)SudanSurinameSwazilandSwedenSwitzerlandSyrian Arab RepublicTajikistanTanzaniaThailandTimor-LesteTogoTongaTrinidad and TobagoTunisiaTurkeyTuvaluUgandaUkraineUnited KingdomUnited StatesUpper middle incomeUruguayVanuatuVenezuela, RBWest Bank and GazaWorldYemen, Rep.ZambiaZimbabwe Linha do tempo:
Nesta escala de tempo está apresentado um gráfico de 1978 ano até 2016 ano Egypt, Arab Rep.. Dados de 1977 ano ausente. O número de observações reais por data: 39.
Fonte (nome):
Indicadores de desenvolvimento mundial
Fonte (organização):
International Monetary Fund, Balance of Payments Statistics Yearbook and data files.
Categorias:
Economy & Growth, Trade
Foi atualizado:
23 abr 2017 ano
Indicadores de alterações dos valores ao longo dos anos
Mínimo:
8.347
1 jan 1987 ano
Máximo:
52.622
1 jan 2011 ano
Na data de observação
Valor
Mudança absoluta
A alteração em relação ao valor anterior
1 jan 1978 ano
39.655
+39.655
0.0%
1 jan 1979 ano
36.004
-3.651
-9.21%
1 jan 1980 ano
26.544
-9.46
-26.27%
1 jan 1981 ano
24.766
-1.778
-6.7%
1 jan 1982 ano
16.465
-8.301
-33.52%
1 jan 1983 ano
12.357
-4.108
-24.95%
1 jan 1984 ano
9.101
-3.255
-26.34%
1 jan 1985 ano
10.966
+1.865
20.49%
1 jan 1986 ano
13.777
+2.811
25.64%
1 jan 1987 ano
8.347
-5.431
-39.42%
1 jan 1988 ano
17.725
+9.378
112.36%
1 jan 1989 ano
20.095
+2.37
13.37%
1 jan 1990 ano
22.885
+2.789
13.88%
1 jan 1991 ano
18.422
-4.462
-19.5%
1 jan 1992 ano
20.242
+1.819
9.88%
1 jan 1993 ano
28.059
+7.817
38.62%
1 jan 1994 ano
24.408
-3.651
-13.01%
1 jan 1995 ano
24.857
+0.45
1.84%
1 jan 1996 ano
31.246
+6.388
25.7%
1 jan 1997 ano
34.559
+3.314
10.61%
1 jan 1998 ano
39.736
+5.177
14.98%
1 jan 1999 ano
31.507
-8.229
-20.71%
1 jan 2000 ano
41.113
+9.605
30.49%
1 jan 2001 ano
44.323
+3.211
7.81%
1 jan 2002 ano
42.025
-2.298
-5.19%
1 jan 2003 ano
40.384
-1.64
-3.9%
1 jan 2004 ano
41.395
+1.011
2.5%
1 jan 2005 ano
43.145
+1.75
4.23%
1 jan 2006 ano
46.785
+3.641
8.44%
1 jan 2007 ano
47.047
+0.262
0.56%
1 jan 2008 ano
46.649
-0.398
-0.85%
1 jan 2009 ano
44.095
-2.554
-5.47%
1 jan 2010 ano
49.979
+5.884
13.34%
1 jan 2011 ano
52.622
+2.643
5.29%
1 jan 2012 ano
45.493
-7.129
-13.55%
1 jan 2013 ano
45.667
+0.174
0.38%
1 jan 2014 ano
33.113
-12.553
-27.49%
1 jan 2015 ano
32.915
-0.199
-0.6%
1 jan 2016 ano
32.716
-0.198
-0.6%
Classificação de países por estatísticas atuais por anos


Comentários: