29
/pt/
pt
AIzaSyAYiBZKx7MnpbEhh9jyipgxe19OcubqV5w
April 1, 2024
151229
Honduras
HND
true
2
1
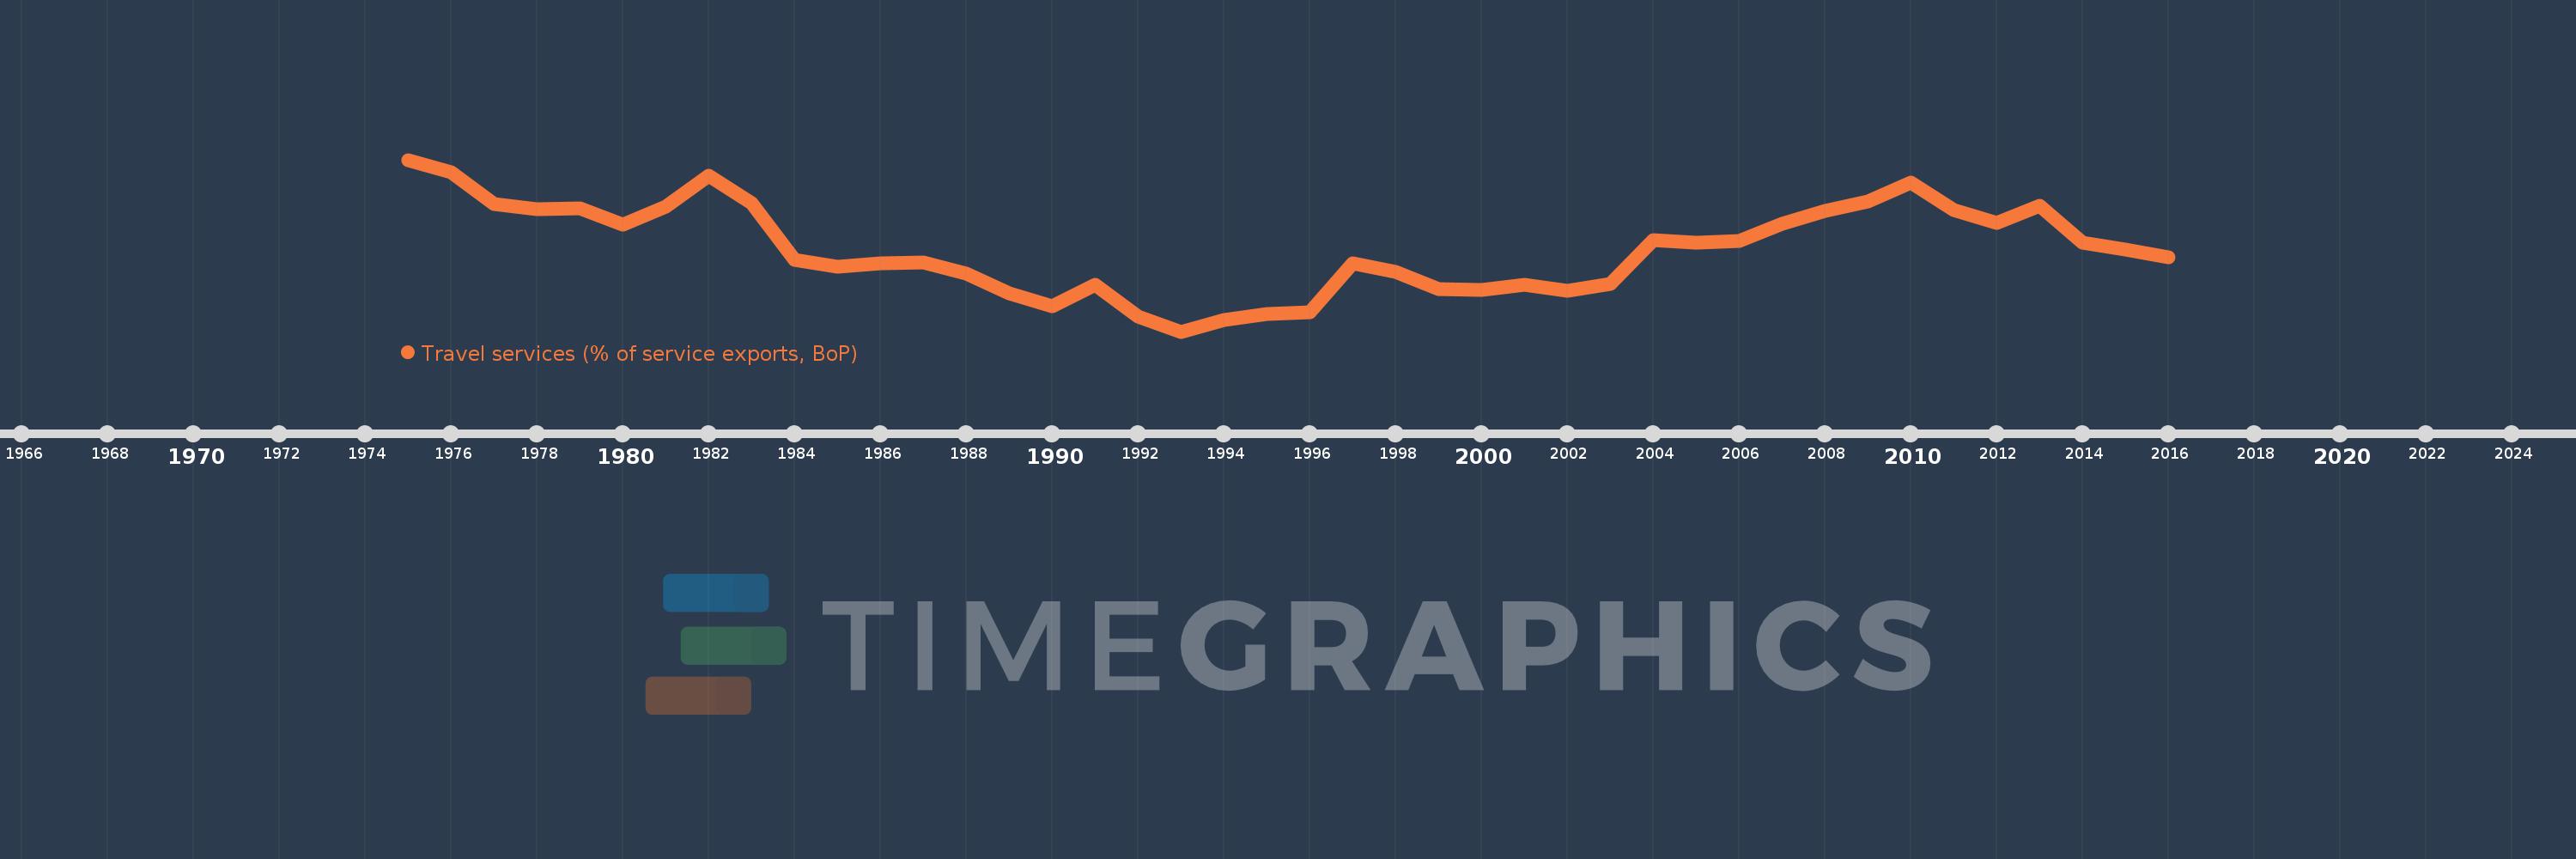
Travel services (% of service exports, BoP)
2016,2015,2014,2013,2012,2011,2010,2009,2008,2007,2006,2005,2004,2003,2002,2001,2000,1999,1998,1997,1996,1995,1994,1993,1992,1991,1990,1989,1988,1987,1986,1985,1984,1983,1982,1981,1980,1979,1978,1977,1976,1975
Estas estatísticas em outros países:
AfghanistanAlbaniaAlgeriaAngolaAntigua and BarbudaArab WorldArgentinaArmeniaArubaAustraliaAustriaAzerbaijanBahamas, TheBahrainBangladeshBarbadosBelarusBelgiumBelizeBeninBermudaBhutanBoliviaBosnia and HerzegovinaBotswanaBrazilBrunei DarussalamBulgariaBurkina FasoBurundiCabo VerdeCambodiaCameroonCanadaCaribbean small statesCentral African RepublicCentral Europe and the BalticsChadChileChinaColombiaComorosCongo, Dem. Rep.Congo, Rep.Costa RicaCote d'IvoireCroatiaCuracaoCyprusCzech RepublicDenmarkDjiboutiDominicaDominican RepublicEarly-demographic dividendEast Asia & PacificEast Asia & Pacific (excluding high income)East Asia & Pacific (IDA & IBRD countries)EcuadorEgypt, Arab Rep.El SalvadorEritreaEstoniaEthiopiaEuro areaEurope & Central AsiaEurope & Central Asia (excluding high income)Europe & Central Asia (IDA & IBRD countries)European UnionFaroe IslandsFijiFinlandFragile and conflict affected situationsFranceFrench PolynesiaGabonGambia, TheGeorgiaGermanyGhanaGreeceGrenadaGuatemalaGuineaGuinea-BissauGuyanaHaitiHeavily indebted poor countries (HIPC)High incomeHondurasHong Kong SAR, ChinaHungaryIBRD onlyIcelandIDA & IBRD totalIDA onlyIDA totalIndiaIndonesiaIran, Islamic Rep.IraqIrelandIsraelItalyJamaicaJapanJordanKazakhstanKenyaKiribatiKorea, Rep.KosovoKuwaitKyrgyz RepublicLao PDRLate-demographic dividendLatin America & Caribbean Latin America & Caribbean (excluding high income)Latin America & the Caribbean (IDA & IBRD countries)LatviaLeast developed countries: UN classificationLebanonLesothoLiberiaLibyaLithuaniaLow & middle incomeLow incomeLower middle incomeLuxembourgMacao SAR, ChinaMacedonia, FYRMadagascarMalawiMalaysiaMaldivesMaliMaltaMarshall IslandsMauritaniaMauritiusMexicoMicronesia, Fed. Sts.Middle East & North Africa (excluding high income)Middle East & North Africa (IDA & IBRD countries)Middle incomeMoldovaMongoliaMontenegroMoroccoMozambiqueMyanmarNamibiaNepalNetherlandsNew CaledoniaNew ZealandNicaraguaNigerNigeriaNorth AmericaNorwayOECD membersOmanOther small statesPacific island small statesPakistanPalauPanamaPapua New GuineaParaguayPeruPhilippinesPolandPortugalPost-demographic dividendPre-demographic dividendQatarRomaniaRussian FederationRwandaSamoaSao Tome and PrincipeSaudi ArabiaSenegalSerbiaSeychellesSierra LeoneSingaporeSint Maarten (Dutch part)Slovak RepublicSloveniaSmall statesSolomon IslandsSouth AfricaSouth AsiaSouth Asia (IDA & IBRD)South SudanSpainSri LankaSt. Kitts and NevisSt. LuciaSt. Vincent and the GrenadinesSub-Saharan Africa Sub-Saharan Africa (excluding high income)Sub-Saharan Africa (IDA & IBRD countries)SudanSurinameSwazilandSwedenSwitzerlandSyrian Arab RepublicTajikistanTanzaniaThailandTimor-LesteTogoTongaTrinidad and TobagoTunisiaTurkeyTuvaluUgandaUkraineUnited KingdomUnited StatesUpper middle incomeUruguayVanuatuVenezuela, RBWest Bank and GazaWorldYemen, Rep.ZambiaZimbabwe Linha do tempo:
Nesta escala de tempo está apresentado um gráfico de 1975 ano até 2016 ano Honduras. Dados de 1974 ano ausente. O número de observações reais por data: 42.
Fonte (nome):
Indicadores de desenvolvimento mundial
Fonte (organização):
International Monetary Fund, Balance of Payments Statistics Yearbook and data files.
Categorias:
Economy & Growth, Trade
Foi atualizado:
23 abr 2017 ano
Indicadores de alterações dos valores ao longo dos anos
Mínimo:
15.743
1 jan 1993 ano
Máximo:
35.484
1 jan 1975 ano
Na data de observação
Valor
Mudança absoluta
A alteração em relação ao valor anterior
1 jan 1975 ano
35.484
+35.484
0.0%
1 jan 1976 ano
34.08
-1.404
-3.96%
1 jan 1977 ano
30.366
-3.714
-10.9%
1 jan 1978 ano
29.838
-0.529
-1.74%
1 jan 1979 ano
29.893
+0.055
0.19%
1 jan 1980 ano
28.081
-1.812
-6.06%
1 jan 1981 ano
30.061
+1.981
7.05%
1 jan 1982 ano
33.664
+3.603
11.99%
1 jan 1983 ano
30.525
-3.139
-9.33%
1 jan 1984 ano
23.987
-6.538
-21.42%
1 jan 1985 ano
23.233
-0.754
-3.14%
1 jan 1986 ano
23.614
+0.382
1.64%
1 jan 1987 ano
23.723
+0.108
0.46%
1 jan 1988 ano
22.357
-1.366
-5.76%
1 jan 1989 ano
20.161
-2.196
-9.82%
1 jan 1990 ano
18.704
-1.457
-7.23%
1 jan 1991 ano
21.122
+2.418
12.93%
1 jan 1992 ano
17.486
-3.636
-17.21%
1 jan 1993 ano
15.743
-1.743
-9.97%
1 jan 1994 ano
17.109
+1.366
8.68%
1 jan 1995 ano
17.804
+0.696
4.07%
1 jan 1996 ano
17.973
+0.169
0.95%
1 jan 1997 ano
23.604
+5.631
31.33%
1 jan 1998 ano
22.651
-0.953
-4.04%
1 jan 1999 ano
20.612
-2.038
-9.0%
1 jan 2000 ano
20.541
-0.071
-0.35%
1 jan 2001 ano
21.154
+0.613
2.98%
1 jan 2002 ano
20.45
-0.704
-3.33%
1 jan 2003 ano
21.224
+0.774
3.78%
1 jan 2004 ano
26.245
+5.021
23.66%
1 jan 2005 ano
25.998
-0.247
-0.94%
1 jan 2006 ano
26.165
+0.168
0.64%
1 jan 2007 ano
28.178
+2.013
7.69%
1 jan 2008 ano
29.625
+1.447
5.14%
1 jan 2009 ano
30.688
+1.063
3.59%
1 jan 2010 ano
32.911
+2.223
7.24%
1 jan 2011 ano
29.678
-3.233
-9.82%
1 jan 2012 ano
28.249
-1.43
-4.82%
1 jan 2013 ano
30.216
+1.967
6.96%
1 jan 2014 ano
25.958
-4.258
-14.09%
1 jan 2015 ano
25.124
-0.834
-3.21%
1 jan 2016 ano
24.299
-0.825
-3.28%
Classificação de países por estatísticas atuais por anos


Comentários: