29
/pt/
pt
AIzaSyAYiBZKx7MnpbEhh9jyipgxe19OcubqV5w
April 1, 2024
40396
IDA total
IDA
false
2
1
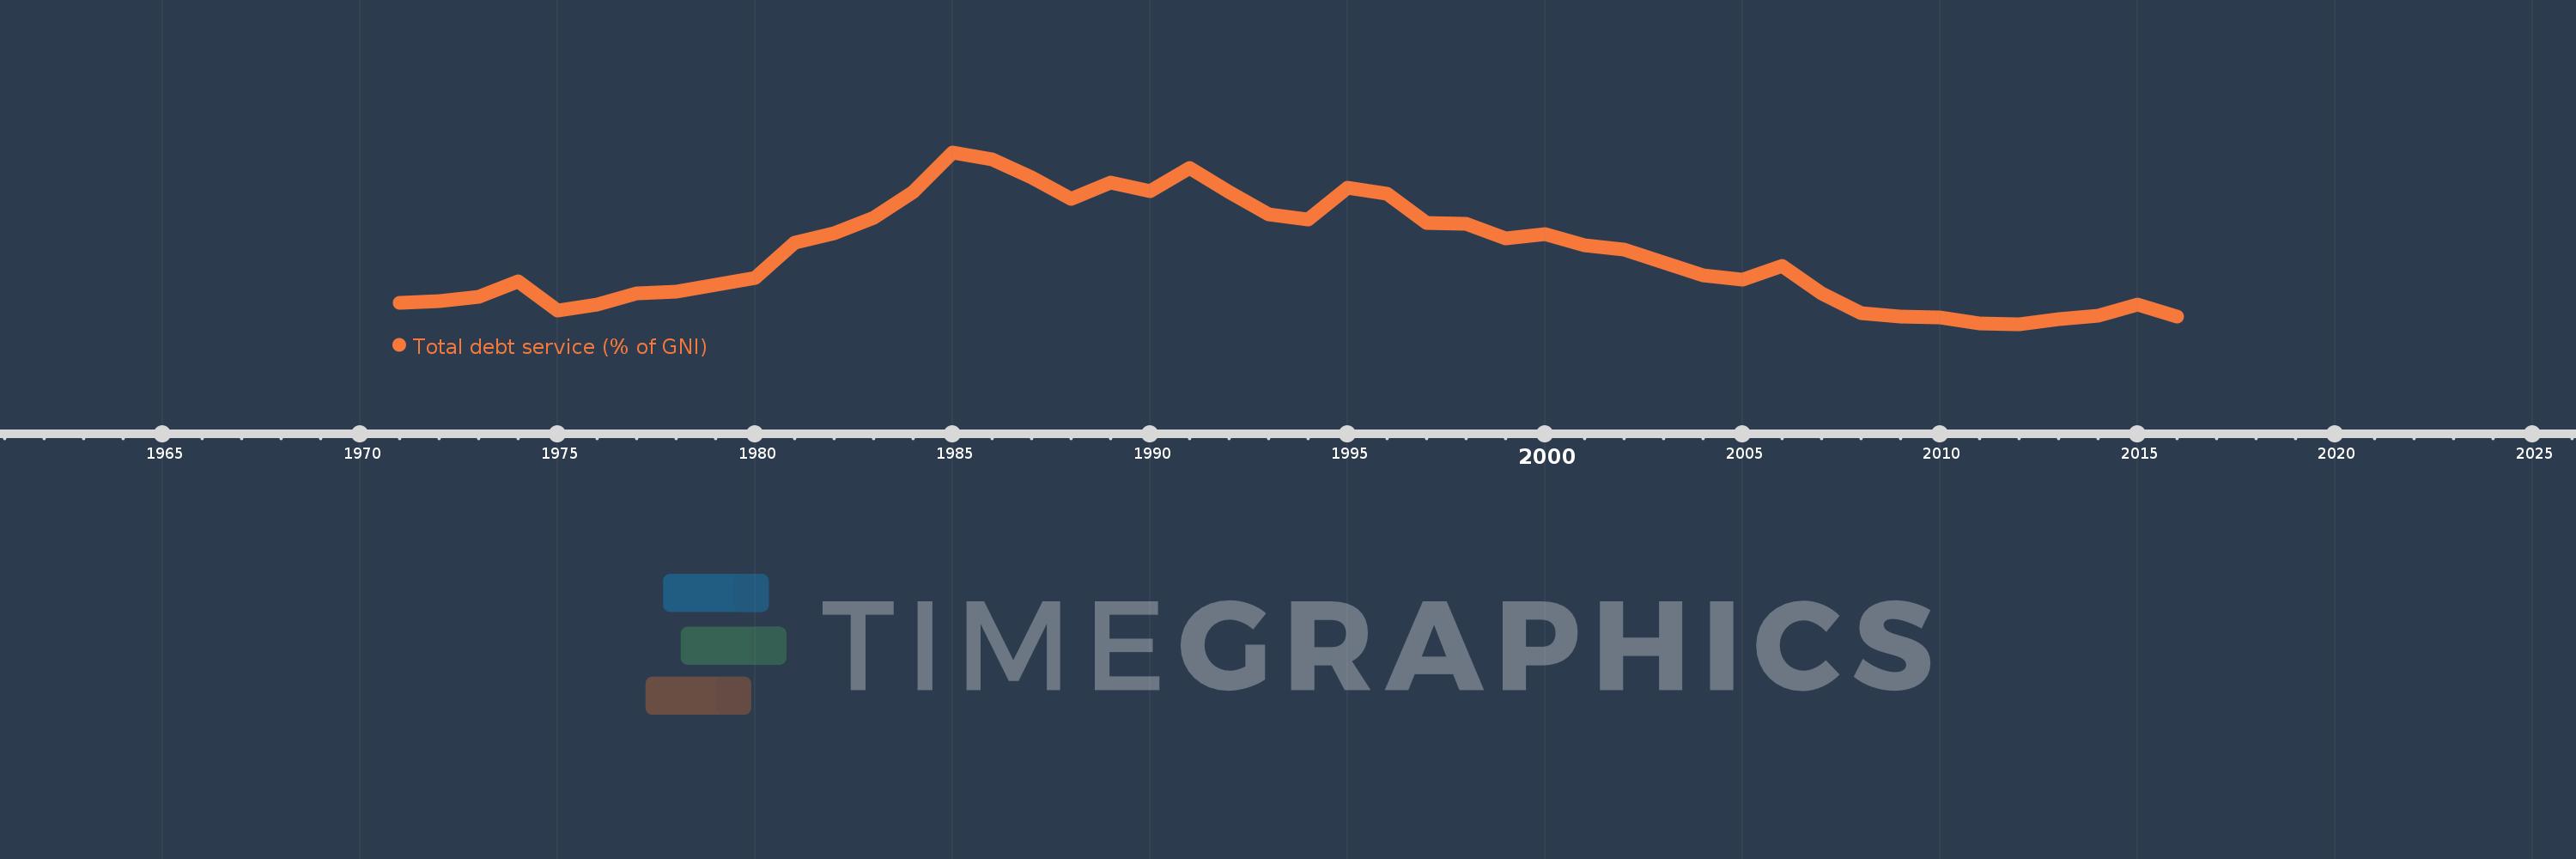
Total debt service (% of GNI)
2016,2015,2014,2013,2012,2011,2010,2009,2008,2007,2006,2005,2004,2003,2002,2001,2000,1999,1998,1997,1996,1995,1994,1993,1992,1991,1990,1989,1988,1987,1986,1985,1984,1983,1982,1981,1980,1979,1978,1977,1976,1975,1974,1973,1972,1971
Estas estatísticas em outros países:
Linha do tempo:
Nesta escala de tempo está apresentado um gráfico de 1971 ano até 2016 ano IDA total. Dados de 1970 ano ausente. O número de observações reais por data: 46.
Fonte (nome):
Indicadores de desenvolvimento mundial
Fonte (organização):
World Bank, International Debt Statistics.
Categorias:
Economy & Growth, External Debt
Foi atualizado:
23 abr 2017 ano
Indicadores de alterações dos valores ao longo dos anos
Mínimo:
1.374
1 jan 2012 ano
Máximo:
6.436
1 jan 1985 ano
Na data de observação
Valor
Mudança absoluta
A alteração em relação ao valor anterior
1 jan 1971 ano
1.997
+1.997
0.0%
1 jan 1972 ano
2.061
+0.063
3.16%
1 jan 1973 ano
2.178
+0.117
5.69%
1 jan 1974 ano
2.648
+0.47
21.59%
1 jan 1975 ano
1.767
-0.881
-33.26%
1 jan 1976 ano
1.962
+0.194
10.99%
1 jan 1977 ano
2.285
+0.323
16.47%
1 jan 1978 ano
2.331
+0.047
2.04%
1 jan 1979 ano
2.544
+0.213
9.14%
1 jan 1980 ano
2.735
+0.19
7.49%
1 jan 1981 ano
3.772
+1.037
37.93%
1 jan 1982 ano
4.055
+0.283
7.52%
1 jan 1983 ano
4.522
+0.467
11.52%
1 jan 1984 ano
5.26
+0.738
16.32%
1 jan 1985 ano
6.436
+1.176
22.35%
1 jan 1986 ano
6.236
-0.2
-3.1%
1 jan 1987 ano
5.688
-0.548
-8.79%
1 jan 1988 ano
5.076
-0.612
-10.76%
1 jan 1989 ano
5.551
+0.476
9.37%
1 jan 1990 ano
5.301
-0.251
-4.51%
1 jan 1991 ano
5.969
+0.669
12.61%
1 jan 1992 ano
5.274
-0.695
-11.64%
1 jan 1993 ano
4.6
-0.675
-12.79%
1 jan 1994 ano
4.465
-0.134
-2.92%
1 jan 1995 ano
5.401
+0.936
20.97%
1 jan 1996 ano
5.228
-0.173
-3.2%
1 jan 1997 ano
4.357
-0.871
-16.66%
1 jan 1998 ano
4.332
-0.025
-0.58%
1 jan 1999 ano
3.91
-0.422
-9.73%
1 jan 2000 ano
4.035
+0.125
3.19%
1 jan 2001 ano
3.703
-0.332
-8.23%
1 jan 2002 ano
3.578
-0.125
-3.38%
1 jan 2003 ano
3.202
-0.376
-10.5%
1 jan 2004 ano
2.82
-0.383
-11.95%
1 jan 2005 ano
2.697
-0.122
-4.34%
1 jan 2006 ano
3.101
+0.404
14.98%
1 jan 2007 ano
2.275
-0.826
-26.64%
1 jan 2008 ano
1.698
-0.577
-25.36%
1 jan 2009 ano
1.592
-0.106
-6.22%
1 jan 2010 ano
1.582
-0.01
-0.63%
1 jan 2011 ano
1.391
-0.192
-12.11%
1 jan 2012 ano
1.374
-0.017
-1.22%
1 jan 2013 ano
1.535
+0.162
11.76%
1 jan 2014 ano
1.635
+0.1
6.48%
1 jan 2015 ano
1.942
+0.307
18.79%
1 jan 2016 ano
1.608
-0.334
-17.19%
Classificação de países por estatísticas atuais por anos


Comentários: