29
/pt/
pt
AIzaSyAYiBZKx7MnpbEhh9jyipgxe19OcubqV5w
April 1, 2024
240067
Sierra Leone
SLE
true
2
1
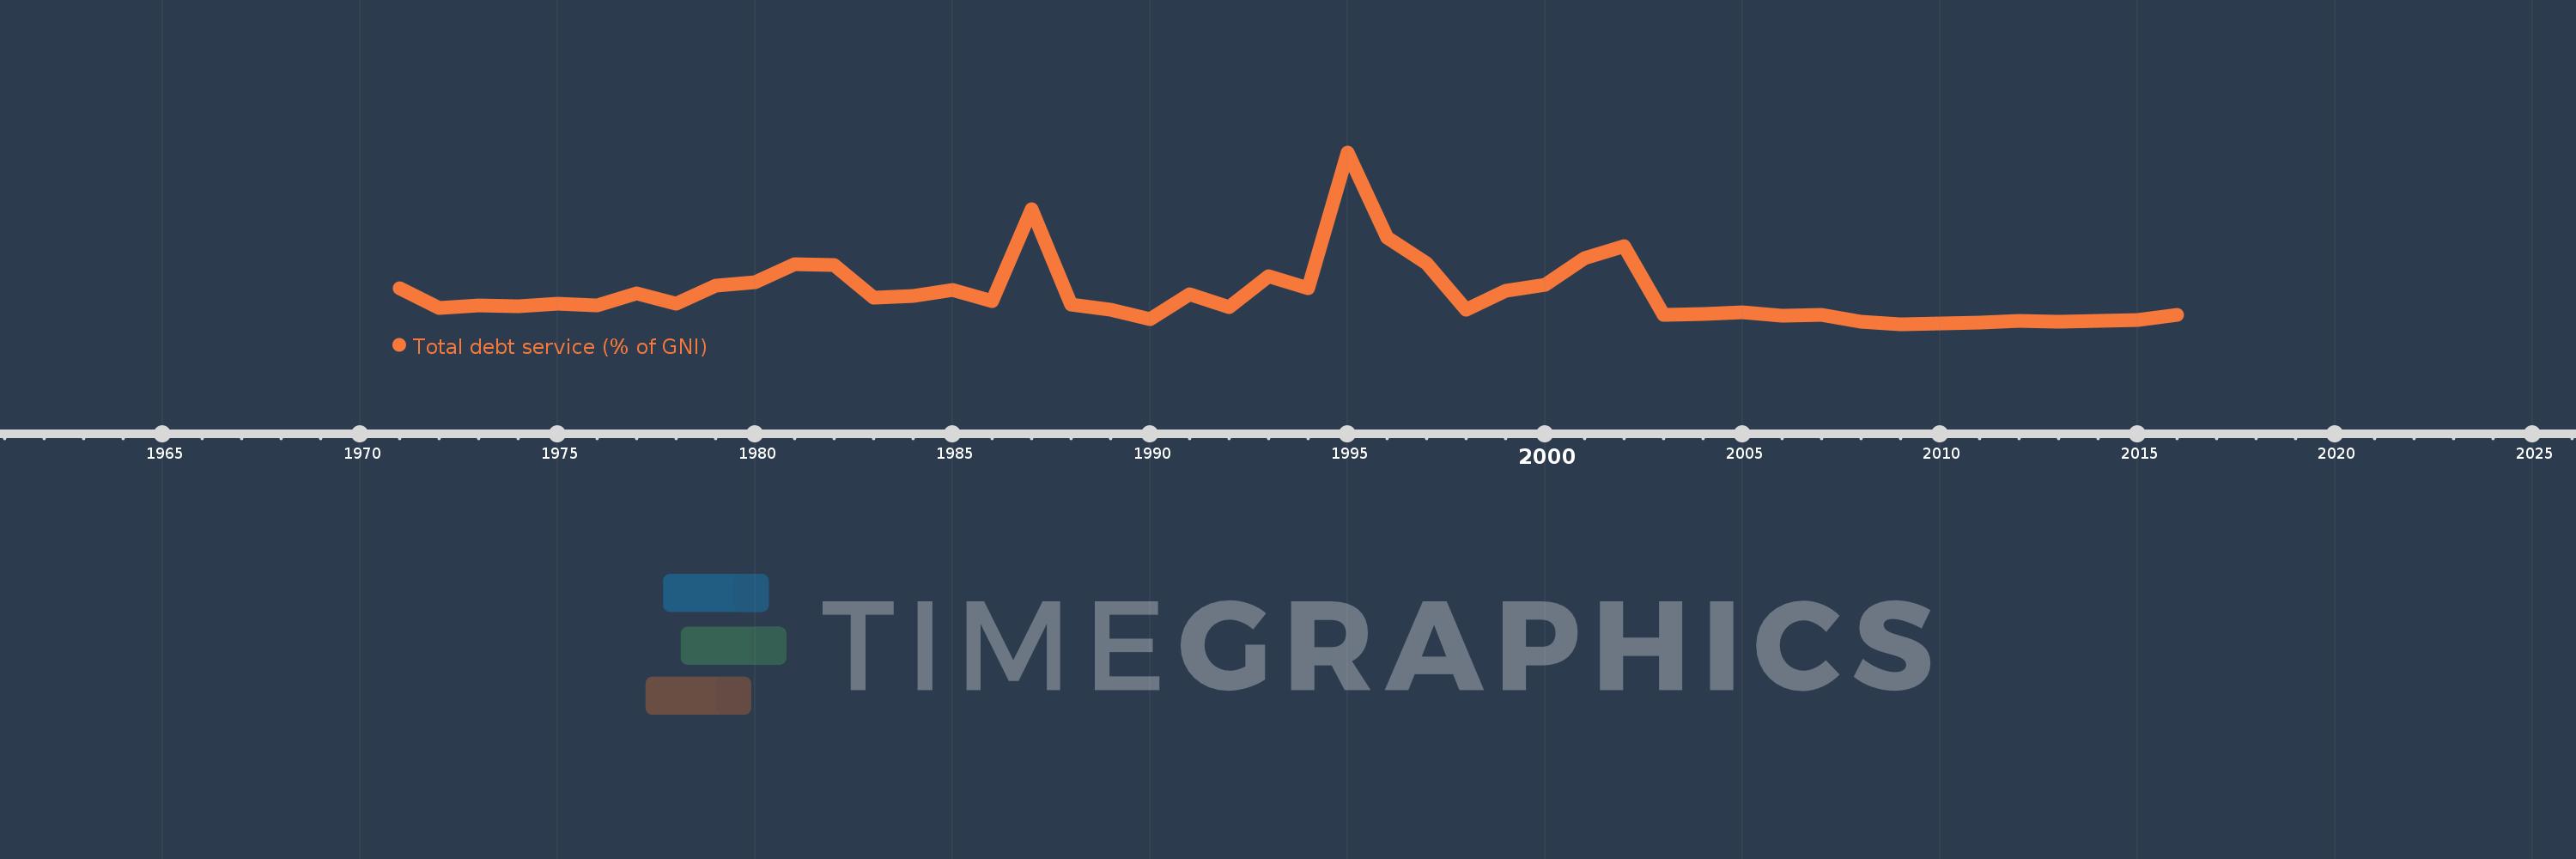
Total debt service (% of GNI)
2016,2015,2014,2013,2012,2011,2010,2009,2008,2007,2006,2005,2004,2003,2002,2001,2000,1999,1998,1997,1996,1995,1994,1993,1992,1991,1990,1989,1988,1987,1986,1985,1984,1983,1982,1981,1980,1979,1978,1977,1976,1975,1974,1973,1972,1971
Estas estatísticas em outros países:
Linha do tempo:
Nesta escala de tempo está apresentado um gráfico de 1971 ano até 2016 ano Sierra Leone. Dados de 1970 ano ausente. O número de observações reais por data: 46.
Fonte (nome):
Indicadores de desenvolvimento mundial
Fonte (organização):
World Bank, International Debt Statistics.
Categorias:
Economy & Growth, External Debt
Foi atualizado:
23 abr 2017 ano
Indicadores de alterações dos valores ao longo dos anos
Mínimo:
0.219
1 jan 2009 ano
Máximo:
19.906
1 jan 1995 ano
Na data de observação
Valor
Mudança absoluta
A alteração em relação ao valor anterior
1 jan 1971 ano
4.336
+4.336
0.0%
1 jan 1972 ano
2.081
-2.255
-52.01%
1 jan 1973 ano
2.338
+0.257
12.34%
1 jan 1974 ano
2.276
-0.062
-2.65%
1 jan 1975 ano
2.541
+0.265
11.66%
1 jan 1976 ano
2.332
-0.21
-8.24%
1 jan 1977 ano
3.793
+1.461
62.66%
1 jan 1978 ano
2.563
-1.23
-32.43%
1 jan 1979 ano
4.653
+2.091
81.59%
1 jan 1980 ano
5.004
+0.35
7.53%
1 jan 1981 ano
7.083
+2.079
41.54%
1 jan 1982 ano
6.989
-0.093
-1.32%
1 jan 1983 ano
3.227
-3.762
-53.83%
1 jan 1984 ano
3.502
+0.275
8.52%
1 jan 1985 ano
4.182
+0.68
19.42%
1 jan 1986 ano
2.875
-1.307
-31.24%
1 jan 1987 ano
13.446
+10.571
367.63%
1 jan 1988 ano
2.45
-10.996
-81.78%
1 jan 1989 ano
1.853
-0.597
-24.36%
1 jan 1990 ano
0.843
-1.011
-54.52%
1 jan 1991 ano
3.67
+2.827
335.42%
1 jan 1992 ano
2.138
-1.532
-41.75%
1 jan 1993 ano
5.728
+3.59
167.9%
1 jan 1994 ano
4.319
-1.408
-24.59%
1 jan 1995 ano
19.906
+15.587
360.87%
1 jan 1996 ano
10.132
-9.775
-49.1%
1 jan 1997 ano
7.226
-2.906
-28.68%
1 jan 1998 ano
1.883
-5.343
-73.95%
1 jan 1999 ano
4.017
+2.134
113.37%
1 jan 2000 ano
4.739
+0.723
17.99%
1 jan 2001 ano
7.742
+3.002
63.35%
1 jan 2002 ano
9.152
+1.41
18.21%
1 jan 2003 ano
1.299
-7.853
-85.81%
1 jan 2004 ano
1.402
+0.103
7.97%
1 jan 2005 ano
1.583
+0.181
12.91%
1 jan 2006 ano
1.155
-0.429
-27.09%
1 jan 2007 ano
1.335
+0.181
15.64%
1 jan 2008 ano
0.471
-0.864
-64.71%
1 jan 2009 ano
0.219
-0.252
-53.54%
1 jan 2010 ano
0.294
+0.075
34.39%
1 jan 2011 ano
0.439
+0.145
49.27%
1 jan 2012 ano
0.643
+0.204
46.49%
1 jan 2013 ano
0.533
-0.11
-17.14%
1 jan 2014 ano
0.56
+0.027
5.01%
1 jan 2015 ano
0.711
+0.151
26.99%
1 jan 2016 ano
1.246
+0.536
75.37%
Classificação de países por estatísticas atuais por anos


Comentários: