29
/pt/
pt
AIzaSyAYiBZKx7MnpbEhh9jyipgxe19OcubqV5w
April 1, 2024
196373
Mexico
MEX
true
2
1
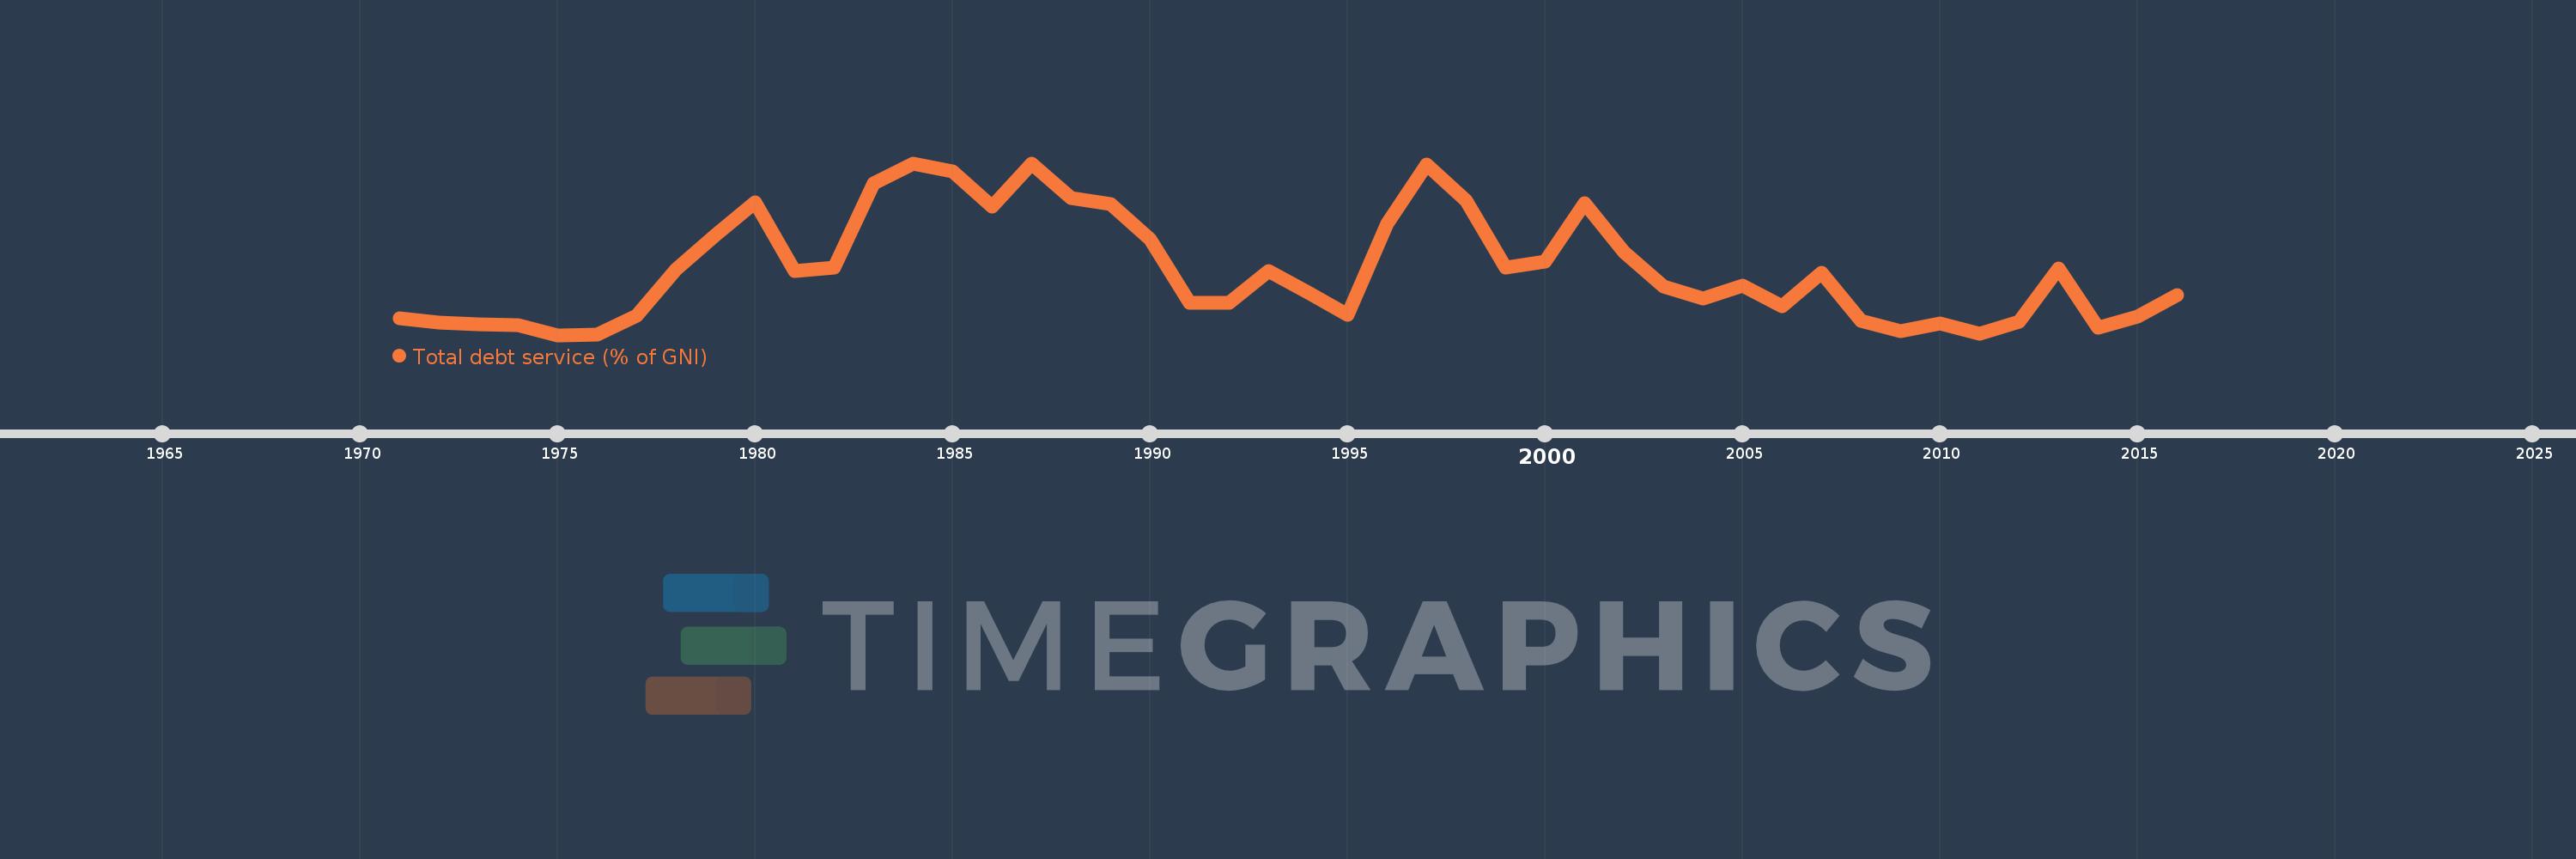
Total debt service (% of GNI)
2016,2015,2014,2013,2012,2011,2010,2009,2008,2007,2006,2005,2004,2003,2002,2001,2000,1999,1998,1997,1996,1995,1994,1993,1992,1991,1990,1989,1988,1987,1986,1985,1984,1983,1982,1981,1980,1979,1978,1977,1976,1975,1974,1973,1972,1971
Estas estatísticas em outros países:
Linha do tempo:
Nesta escala de tempo está apresentado um gráfico de 1971 ano até 2016 ano Mexico. Dados de 1970 ano ausente. O número de observações reais por data: 46.
Fonte (nome):
Indicadores de desenvolvimento mundial
Fonte (organização):
World Bank, International Debt Statistics.
Categorias:
Economy & Growth, External Debt
Foi atualizado:
23 abr 2017 ano
Indicadores de alterações dos valores ao longo dos anos
Mínimo:
3.015
1 jan 1975 ano
Máximo:
10.635
1 jan 1987 ano
Na data de observação
Valor
Mudança absoluta
A alteração em relação ao valor anterior
1 jan 1971 ano
3.763
+3.763
0.0%
1 jan 1972 ano
3.573
-0.19
-5.05%
1 jan 1973 ano
3.483
-0.089
-2.51%
1 jan 1974 ano
3.464
-0.019
-0.55%
1 jan 1975 ano
3.015
-0.449
-12.96%
1 jan 1976 ano
3.048
+0.033
1.11%
1 jan 1977 ano
3.872
+0.824
27.02%
1 jan 1978 ano
5.947
+2.074
53.57%
1 jan 1979 ano
7.472
+1.525
25.65%
1 jan 1980 ano
8.901
+1.429
19.12%
1 jan 1981 ano
5.844
-3.056
-34.34%
1 jan 1982 ano
5.987
+0.143
2.45%
1 jan 1983 ano
9.729
+3.742
62.49%
1 jan 1984 ano
10.625
+0.896
9.21%
1 jan 1985 ano
10.257
-0.368
-3.46%
1 jan 1986 ano
8.728
-1.53
-14.91%
1 jan 1987 ano
10.635
+1.907
21.85%
1 jan 1988 ano
9.073
-1.561
-14.68%
1 jan 1989 ano
8.81
-0.264
-2.91%
1 jan 1990 ano
7.26
-1.549
-17.59%
1 jan 1991 ano
4.461
-2.799
-38.55%
1 jan 1992 ano
4.436
-0.026
-0.57%
1 jan 1993 ano
5.867
+1.431
32.27%
1 jan 1994 ano
4.904
-0.963
-16.41%
1 jan 1995 ano
3.92
-0.984
-20.07%
1 jan 1996 ano
7.934
+4.014
102.4%
1 jan 1997 ano
10.569
+2.635
33.21%
1 jan 1998 ano
8.982
-1.587
-15.02%
1 jan 1999 ano
6.012
-2.971
-33.07%
1 jan 2000 ano
6.275
+0.263
4.38%
1 jan 2001 ano
8.859
+2.585
41.19%
1 jan 2002 ano
6.707
-2.152
-24.3%
1 jan 2003 ano
5.171
-1.535
-22.89%
1 jan 2004 ano
4.617
-0.555
-10.73%
1 jan 2005 ano
5.222
+0.605
13.11%
1 jan 2006 ano
4.287
-0.934
-17.9%
1 jan 2007 ano
5.785
+1.497
34.92%
1 jan 2008 ano
3.633
-2.152
-37.2%
1 jan 2009 ano
3.191
-0.442
-12.16%
1 jan 2010 ano
3.523
+0.332
10.41%
1 jan 2011 ano
3.085
-0.438
-12.44%
1 jan 2012 ano
3.591
+0.505
16.38%
1 jan 2013 ano
5.982
+2.391
66.59%
1 jan 2014 ano
3.346
-2.636
-44.07%
1 jan 2015 ano
3.832
+0.486
14.52%
1 jan 2016 ano
4.781
+0.949
24.77%
Classificação de países por estatísticas atuais por anos


Comentários: