29
/pt/
pt
AIzaSyAYiBZKx7MnpbEhh9jyipgxe19OcubqV5w
April 1, 2024
39473
IDA only
IDX
false
2
1
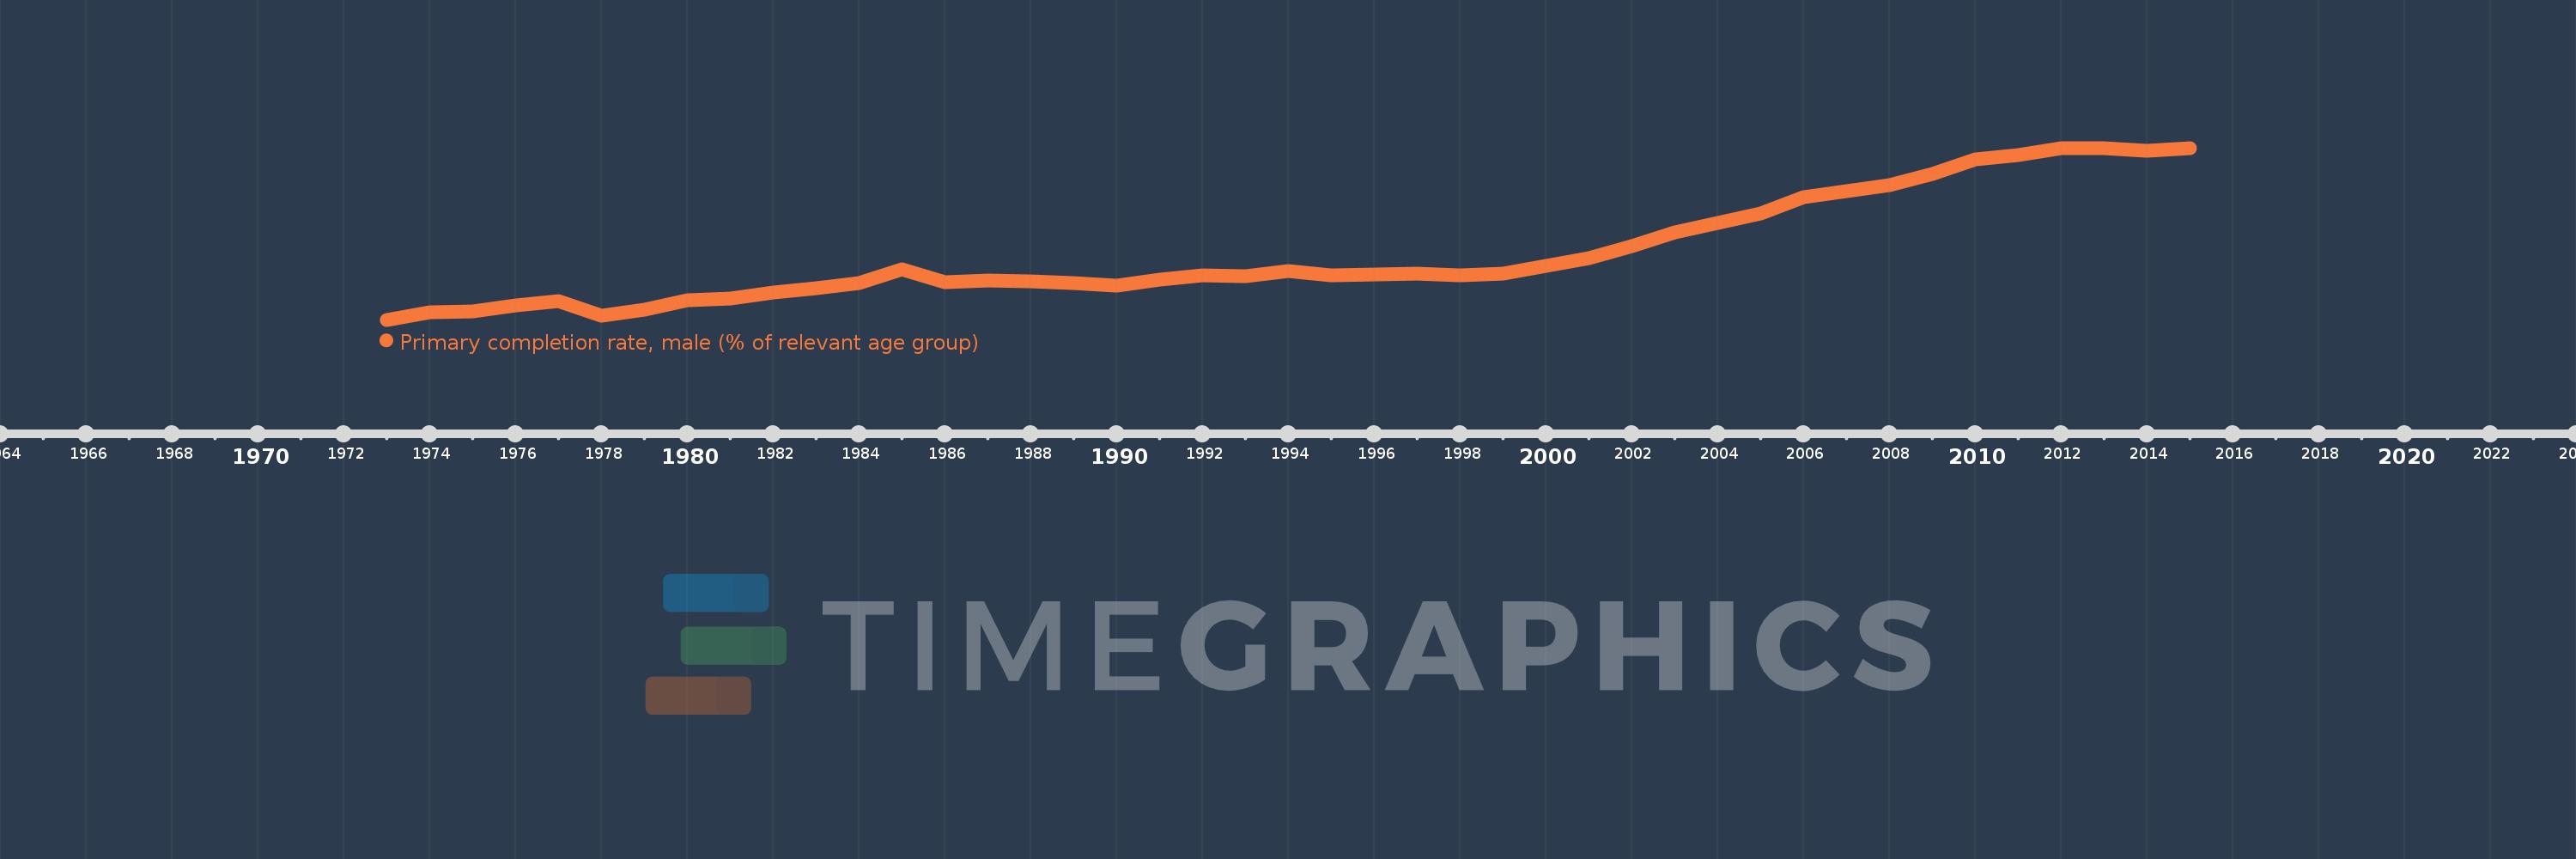
Primary completion rate, male (% of relevant age group)
2015,2014,2013,2012,2011,2010,2009,2008,2007,2006,2005,2004,2003,2002,2001,2000,1999,1998,1997,1996,1995,1994,1993,1992,1991,1990,1989,1988,1987,1986,1985,1984,1983,1982,1981,1980,1979,1978,1977,1976,1975,1974,1973
Estas estatísticas em outros países:
AfghanistanAlbaniaAlgeriaAngolaAntigua and BarbudaArab WorldArgentinaArmeniaArubaAustriaAzerbaijanBahamas, TheBahrainBangladeshBarbadosBelarusBelgiumBelizeBeninBermudaBhutanBoliviaBosnia and HerzegovinaBotswanaBrunei DarussalamBulgariaBurkina FasoBurundiCabo VerdeCambodiaCameroonCanadaCaribbean small statesCentral African RepublicCentral Europe and the BalticsChadChileChinaColombiaComorosCongo, Dem. Rep.Congo, Rep.Costa RicaCote d'IvoireCroatiaCubaCyprusCzech RepublicDenmarkDjiboutiDominicaDominican RepublicEarly-demographic dividendEast Asia & PacificEast Asia & Pacific (excluding high income)East Asia & Pacific (IDA & IBRD countries)EcuadorEgypt, Arab Rep.El SalvadorEquatorial GuineaEritreaEstoniaEthiopiaEuro areaEurope & Central AsiaEurope & Central Asia (excluding high income)Europe & Central Asia (IDA & IBRD countries)European UnionFijiFinlandFragile and conflict affected situationsFranceGabonGambia, TheGeorgiaGermanyGhanaGreeceGrenadaGuatemalaGuineaGuinea-BissauGuyanaHaitiHeavily indebted poor countries (HIPC)High incomeHondurasHong Kong SAR, ChinaHungaryIBRD onlyIcelandIDA & IBRD totalIDA blendIDA onlyIDA totalIndiaIndonesiaIran, Islamic Rep.IraqIrelandIsraelItalyJamaicaJapanJordanKazakhstanKenyaKiribatiKorea, Dem. People’s Rep.Korea, Rep.KuwaitKyrgyz RepublicLao PDRLate-demographic dividendLatin America & Caribbean Latin America & Caribbean (excluding high income)Latin America & the Caribbean (IDA & IBRD countries)LatviaLeast developed countries: UN classificationLebanonLesothoLiberiaLibyaLiechtensteinLithuaniaLow & middle incomeLow incomeLower middle incomeLuxembourgMacao SAR, ChinaMacedonia, FYRMadagascarMalawiMaldivesMaliMaltaMarshall IslandsMauritaniaMauritiusMexicoMiddle East & North AfricaMiddle East & North Africa (excluding high income)Middle East & North Africa (IDA & IBRD countries)Middle incomeMoldovaMongoliaMontenegroMoroccoMozambiqueMyanmarNamibiaNauruNepalNetherlandsNew ZealandNicaraguaNigerNigeriaNorwayOECD membersOmanOther small statesPacific island small statesPakistanPalauPanamaPapua New GuineaParaguayPeruPhilippinesPolandPortugalPost-demographic dividendPre-demographic dividendQatarRomaniaRussian FederationRwandaSamoaSan MarinoSao Tome and PrincipeSaudi ArabiaSenegalSerbiaSeychellesSierra LeoneSlovak RepublicSloveniaSmall statesSolomon IslandsSouth AfricaSouth AsiaSouth Asia (IDA & IBRD)South SudanSpainSri LankaSt. Kitts and NevisSt. LuciaSt. Vincent and the GrenadinesSub-Saharan Africa Sub-Saharan Africa (excluding high income)Sub-Saharan Africa (IDA & IBRD countries)SudanSurinameSwazilandSwedenSwitzerlandSyrian Arab RepublicTajikistanTanzaniaThailandTimor-LesteTogoTongaTrinidad and TobagoTunisiaTurkeyTuvaluUgandaUkraineUnited Arab EmiratesUpper middle incomeUruguayUzbekistanVanuatuVenezuela, RBVietnamWest Bank and GazaWorldYemen, Rep.ZambiaZimbabwe Linha do tempo:
Nesta escala de tempo está apresentado um gráfico de 1973 ano até 2015 ano IDA only. Dados de 1972 ano ausente. O número de observações reais por data: 43.
Fonte (nome):
Indicadores de desenvolvimento mundial
Fonte (organização):
United Nations Educational, Scientific, and Cultural Organization (UNESCO) Institute for Statistics.
Categorias:
Education, Gender
Foi atualizado:
23 abr 2017 ano
Indicadores de alterações dos valores ao longo dos anos
Mínimo:
47.038
1 jan 1973 ano
Máximo:
71.883
1 jan 2012 ano
Na data de observação
Valor
Mudança absoluta
A alteração em relação ao valor anterior
1 jan 1973 ano
47.038
+47.038
0.0%
1 jan 1974 ano
48.084
+1.047
2.23%
1 jan 1975 ano
48.227
+0.142
0.3%
1 jan 1976 ano
49.084
+0.857
1.78%
1 jan 1977 ano
49.756
+0.671
1.37%
1 jan 1978 ano
47.678
-2.078
-4.18%
1 jan 1979 ano
48.48
+0.802
1.68%
1 jan 1980 ano
49.797
+1.317
2.72%
1 jan 1981 ano
50.116
+0.319
0.64%
1 jan 1982 ano
50.955
+0.839
1.67%
1 jan 1983 ano
51.579
+0.624
1.23%
1 jan 1984 ano
52.332
+0.753
1.46%
1 jan 1985 ano
54.385
+2.053
3.92%
1 jan 1986 ano
52.469
-1.916
-3.52%
1 jan 1987 ano
52.664
+0.195
0.37%
1 jan 1988 ano
52.555
-0.108
-0.21%
1 jan 1989 ano
52.351
-0.204
-0.39%
1 jan 1990 ano
51.957
-0.394
-0.75%
1 jan 1991 ano
52.779
+0.822
1.58%
1 jan 1992 ano
53.487
+0.709
1.34%
1 jan 1993 ano
53.354
-0.133
-0.25%
1 jan 1994 ano
54.055
+0.701
1.31%
1 jan 1995 ano
53.493
-0.561
-1.04%
1 jan 1996 ano
53.573
+0.08
0.15%
1 jan 1997 ano
53.657
+0.083
0.16%
1 jan 1998 ano
53.483
-0.174
-0.32%
1 jan 1999 ano
53.751
+0.269
0.5%
1 jan 2000 ano
54.889
+1.137
2.12%
1 jan 2001 ano
55.977
+1.089
1.98%
1 jan 2002 ano
57.72
+1.743
3.11%
1 jan 2003 ano
59.652
+1.932
3.35%
1 jan 2004 ano
61.037
+1.385
2.32%
1 jan 2005 ano
62.421
+1.384
2.27%
1 jan 2006 ano
64.713
+2.293
3.67%
1 jan 2007 ano
65.62
+0.906
1.4%
1 jan 2008 ano
66.531
+0.911
1.39%
1 jan 2009 ano
68.096
+1.565
2.35%
1 jan 2010 ano
70.291
+2.195
3.22%
1 jan 2011 ano
70.896
+0.605
0.86%
1 jan 2012 ano
71.883
+0.986
1.39%
1 jan 2013 ano
71.827
-0.056
-0.08%
1 jan 2014 ano
71.436
-0.391
-0.54%
1 jan 2015 ano
71.796
+0.36
0.5%
Classificação de países por estatísticas atuais por anos


Comentários: