29
/pt/
pt
AIzaSyAYiBZKx7MnpbEhh9jyipgxe19OcubqV5w
April 1, 2024
278181
Uruguay
URY
true
2
1
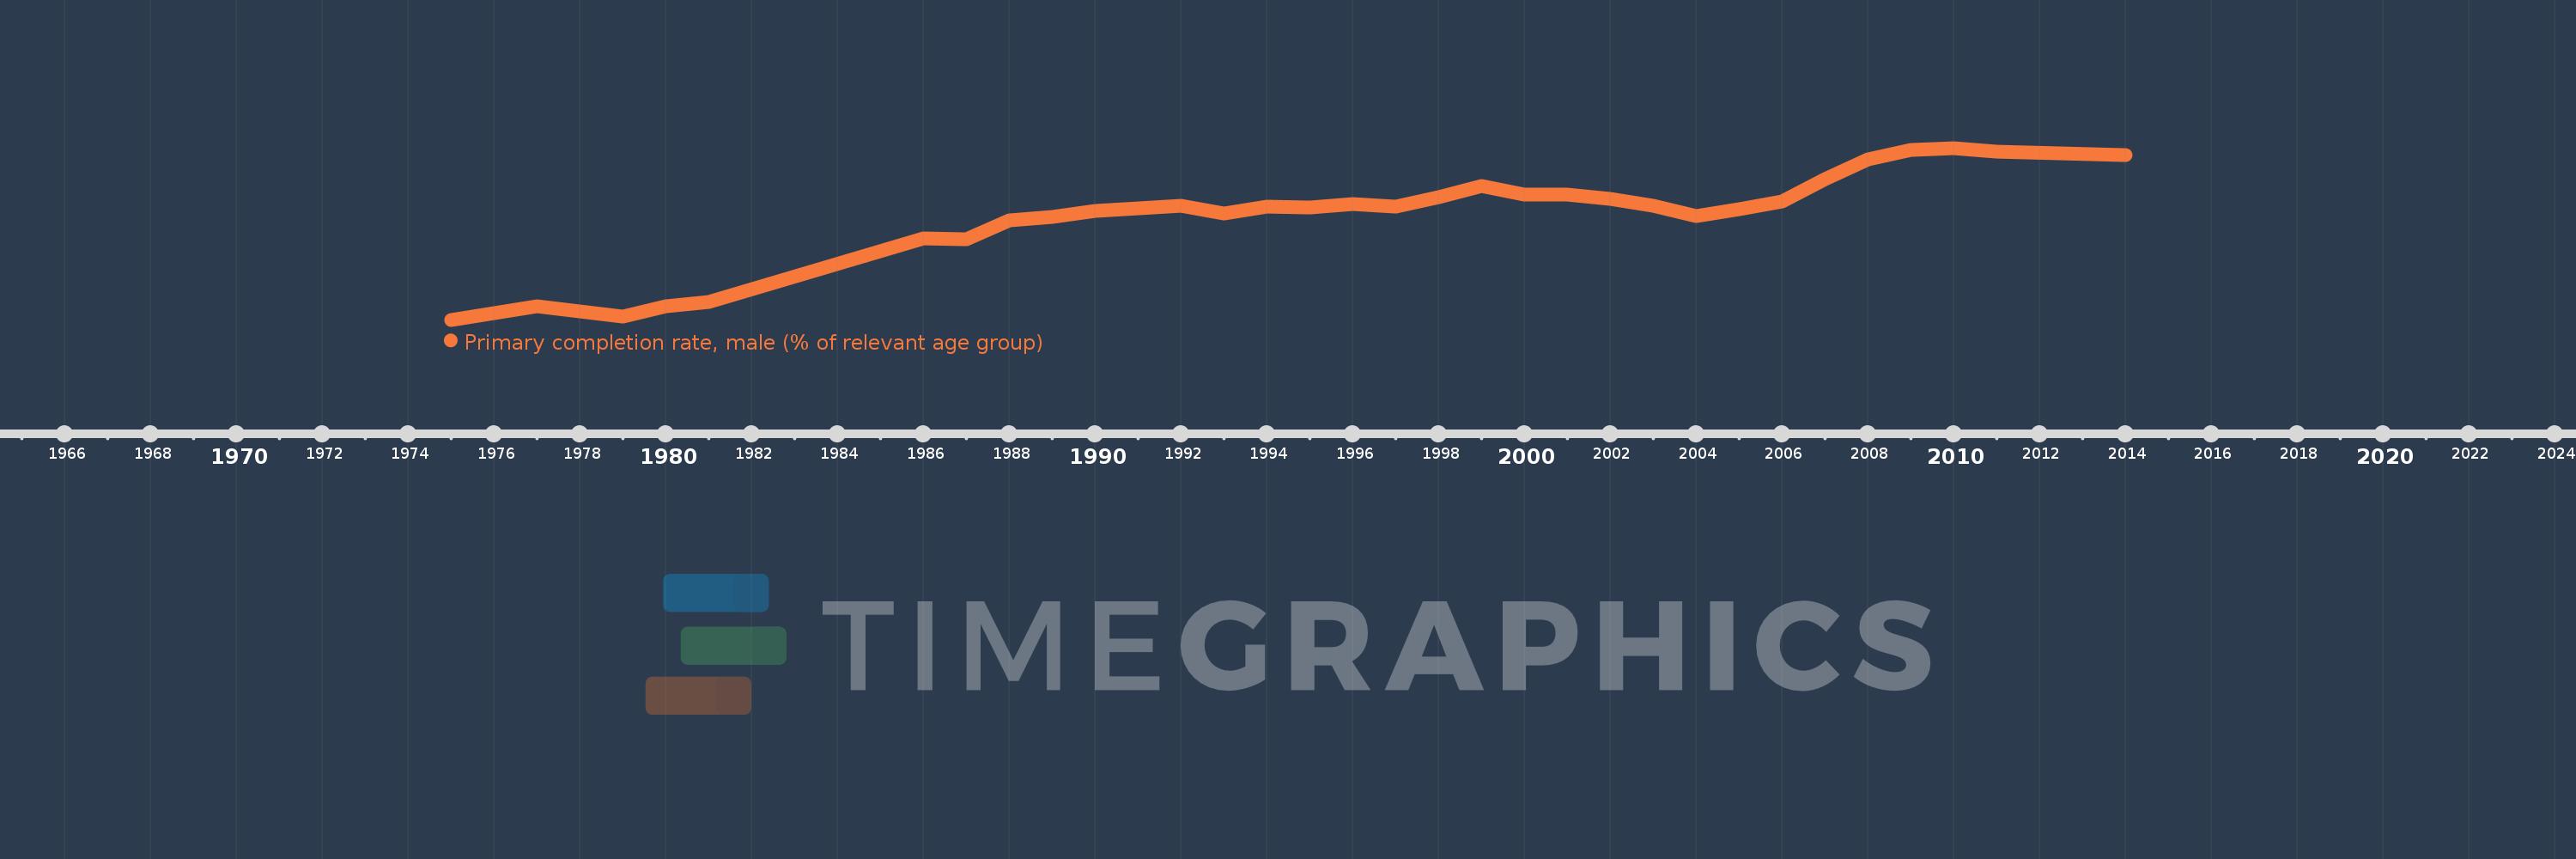
Primary completion rate, male (% of relevant age group)
2014,2011,2010,2009,2008,2007,2006,2005,2004,2003,2002,2001,2000,1999,1998,1997,1996,1995,1994,1993,1992,1991,1990,1989,1988,1987,1986,1981,1980,1979,1978,1977,1975
Estas estatísticas em outros países:
AfghanistanAlbaniaAlgeriaAngolaAntigua and BarbudaArab WorldArgentinaArmeniaArubaAustriaAzerbaijanBahamas, TheBahrainBangladeshBarbadosBelarusBelgiumBelizeBeninBermudaBhutanBoliviaBosnia and HerzegovinaBotswanaBrunei DarussalamBulgariaBurkina FasoBurundiCabo VerdeCambodiaCameroonCanadaCaribbean small statesCentral African RepublicCentral Europe and the BalticsChadChileChinaColombiaComorosCongo, Dem. Rep.Congo, Rep.Costa RicaCote d'IvoireCroatiaCubaCyprusCzech RepublicDenmarkDjiboutiDominicaDominican RepublicEarly-demographic dividendEast Asia & PacificEast Asia & Pacific (excluding high income)East Asia & Pacific (IDA & IBRD countries)EcuadorEgypt, Arab Rep.El SalvadorEquatorial GuineaEritreaEstoniaEthiopiaEuro areaEurope & Central AsiaEurope & Central Asia (excluding high income)Europe & Central Asia (IDA & IBRD countries)European UnionFijiFinlandFragile and conflict affected situationsFranceGabonGambia, TheGeorgiaGermanyGhanaGreeceGrenadaGuatemalaGuineaGuinea-BissauGuyanaHaitiHeavily indebted poor countries (HIPC)High incomeHondurasHong Kong SAR, ChinaHungaryIBRD onlyIcelandIDA & IBRD totalIDA blendIDA onlyIDA totalIndiaIndonesiaIran, Islamic Rep.IraqIrelandIsraelItalyJamaicaJapanJordanKazakhstanKenyaKiribatiKorea, Dem. People’s Rep.Korea, Rep.KuwaitKyrgyz RepublicLao PDRLate-demographic dividendLatin America & Caribbean Latin America & Caribbean (excluding high income)Latin America & the Caribbean (IDA & IBRD countries)LatviaLeast developed countries: UN classificationLebanonLesothoLiberiaLibyaLiechtensteinLithuaniaLow & middle incomeLow incomeLower middle incomeLuxembourgMacao SAR, ChinaMacedonia, FYRMadagascarMalawiMaldivesMaliMaltaMarshall IslandsMauritaniaMauritiusMexicoMiddle East & North AfricaMiddle East & North Africa (excluding high income)Middle East & North Africa (IDA & IBRD countries)Middle incomeMoldovaMongoliaMontenegroMoroccoMozambiqueMyanmarNamibiaNauruNepalNetherlandsNew ZealandNicaraguaNigerNigeriaNorwayOECD membersOmanOther small statesPacific island small statesPakistanPalauPanamaPapua New GuineaParaguayPeruPhilippinesPolandPortugalPost-demographic dividendPre-demographic dividendQatarRomaniaRussian FederationRwandaSamoaSan MarinoSao Tome and PrincipeSaudi ArabiaSenegalSerbiaSeychellesSierra LeoneSlovak RepublicSloveniaSmall statesSolomon IslandsSouth AfricaSouth AsiaSouth Asia (IDA & IBRD)South SudanSpainSri LankaSt. Kitts and NevisSt. LuciaSt. Vincent and the GrenadinesSub-Saharan Africa Sub-Saharan Africa (excluding high income)Sub-Saharan Africa (IDA & IBRD countries)SudanSurinameSwazilandSwedenSwitzerlandSyrian Arab RepublicTajikistanTanzaniaThailandTimor-LesteTogoTongaTrinidad and TobagoTunisiaTurkeyTuvaluUgandaUkraineUnited Arab EmiratesUpper middle incomeUruguayUzbekistanVanuatuVenezuela, RBVietnamWest Bank and GazaWorldYemen, Rep.ZambiaZimbabwe Linha do tempo:
Nesta escala de tempo está apresentado um gráfico de 1975 ano até 2014 ano Uruguay. Dados de 1974 ano ausente. O número de observações reais por data: 33.
Fonte (nome):
Indicadores de desenvolvimento mundial
Fonte (organização):
United Nations Educational, Scientific, and Cultural Organization (UNESCO) Institute for Statistics.
Categorias:
Education, Gender
Foi atualizado:
23 abr 2017 ano
Indicadores de alterações dos valores ao longo dos anos
Mínimo:
66.807
1 jan 1975 ano
Máximo:
105.383
1 jan 2010 ano
Na data de observação
Valor
Mudança absoluta
A alteração em relação ao valor anterior
1 jan 1975 ano
66.807
+66.807
0.0%
1 jan 1977 ano
69.741
+2.933
4.39%
1 jan 1978 ano
68.708
-1.032
-1.48%
1 jan 1979 ano
67.56
-1.149
-1.67%
1 jan 1980 ano
69.806
+2.246
3.32%
1 jan 1981 ano
70.84
+1.034
1.48%
1 jan 1986 ano
85.144
+14.304
20.19%
1 jan 1987 ano
84.932
-0.212
-0.25%
1 jan 1988 ano
89.09
+4.158
4.9%
1 jan 1989 ano
89.868
+0.778
0.87%
1 jan 1990 ano
91.19
+1.322
1.47%
1 jan 1991 ano
91.916
+0.726
0.8%
1 jan 1992 ano
92.463
+0.546
0.59%
1 jan 1993 ano
90.588
-1.875
-2.03%
1 jan 1994 ano
92.141
+1.554
1.72%
1 jan 1995 ano
92.108
-0.034
-0.04%
1 jan 1996 ano
92.819
+0.711
0.77%
1 jan 1997 ano
92.268
-0.551
-0.59%
1 jan 1998 ano
94.289
+2.022
2.19%
1 jan 1999 ano
96.915
+2.625
2.78%
1 jan 2000 ano
94.915
-2.0
-2.06%
1 jan 2001 ano
95.0
+0.085
0.09%
1 jan 2002 ano
93.864
-1.136
-1.2%
1 jan 2003 ano
92.412
-1.451
-1.55%
1 jan 2004 ano
90.088
-2.324
-2.51%
1 jan 2005 ano
91.561
+1.473
1.63%
1 jan 2006 ano
93.359
+1.798
1.96%
1 jan 2007 ano
98.358
+4.998
5.35%
1 jan 2008 ano
102.735
+4.377
4.45%
1 jan 2009 ano
104.891
+2.156
2.1%
1 jan 2010 ano
105.383
+0.492
0.47%
1 jan 2011 ano
104.615
-0.768
-0.73%
1 jan 2014 ano
103.808
-0.807
-0.77%
Classificação de países por estatísticas atuais por anos


Comentários: