29
/pt/
pt
AIzaSyAYiBZKx7MnpbEhh9jyipgxe19OcubqV5w
April 1, 2024
164176
Japan
JPN
true
2
1
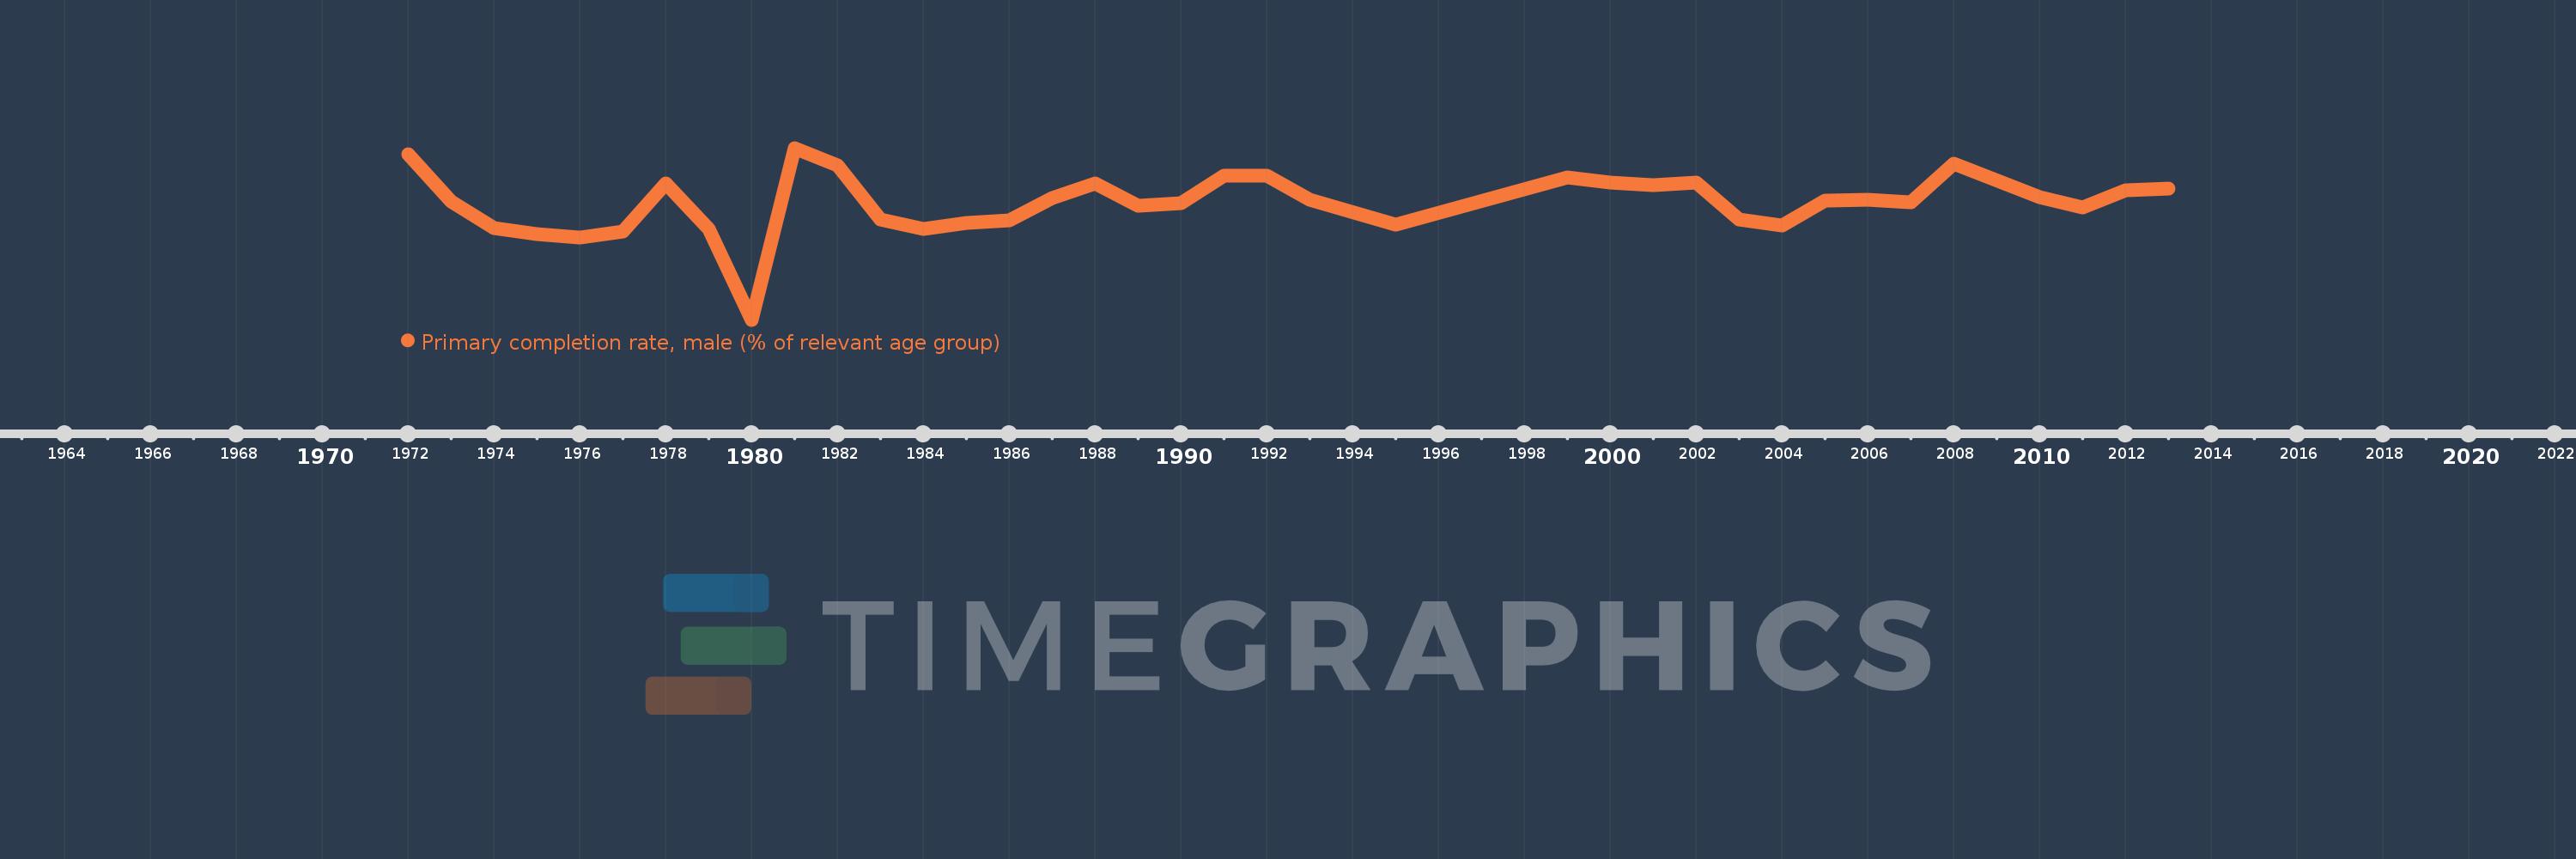
Primary completion rate, male (% of relevant age group)
2013,2012,2011,2010,2008,2007,2006,2005,2004,2003,2002,2001,2000,1999,1995,1993,1992,1991,1990,1989,1988,1987,1986,1985,1984,1983,1982,1981,1980,1979,1978,1977,1976,1975,1974,1973,1972
Estas estatísticas em outros países:
AfghanistanAlbaniaAlgeriaAngolaAntigua and BarbudaArab WorldArgentinaArmeniaArubaAustriaAzerbaijanBahamas, TheBahrainBangladeshBarbadosBelarusBelgiumBelizeBeninBermudaBhutanBoliviaBosnia and HerzegovinaBotswanaBrunei DarussalamBulgariaBurkina FasoBurundiCabo VerdeCambodiaCameroonCanadaCaribbean small statesCentral African RepublicCentral Europe and the BalticsChadChileChinaColombiaComorosCongo, Dem. Rep.Congo, Rep.Costa RicaCote d'IvoireCroatiaCubaCyprusCzech RepublicDenmarkDjiboutiDominicaDominican RepublicEarly-demographic dividendEast Asia & PacificEast Asia & Pacific (excluding high income)East Asia & Pacific (IDA & IBRD countries)EcuadorEgypt, Arab Rep.El SalvadorEquatorial GuineaEritreaEstoniaEthiopiaEuro areaEurope & Central AsiaEurope & Central Asia (excluding high income)Europe & Central Asia (IDA & IBRD countries)European UnionFijiFinlandFragile and conflict affected situationsFranceGabonGambia, TheGeorgiaGermanyGhanaGreeceGrenadaGuatemalaGuineaGuinea-BissauGuyanaHaitiHeavily indebted poor countries (HIPC)High incomeHondurasHong Kong SAR, ChinaHungaryIBRD onlyIcelandIDA & IBRD totalIDA blendIDA onlyIDA totalIndiaIndonesiaIran, Islamic Rep.IraqIrelandIsraelItalyJamaicaJapanJordanKazakhstanKenyaKiribatiKorea, Dem. People’s Rep.Korea, Rep.KuwaitKyrgyz RepublicLao PDRLate-demographic dividendLatin America & Caribbean Latin America & Caribbean (excluding high income)Latin America & the Caribbean (IDA & IBRD countries)LatviaLeast developed countries: UN classificationLebanonLesothoLiberiaLibyaLiechtensteinLithuaniaLow & middle incomeLow incomeLower middle incomeLuxembourgMacao SAR, ChinaMacedonia, FYRMadagascarMalawiMaldivesMaliMaltaMarshall IslandsMauritaniaMauritiusMexicoMiddle East & North AfricaMiddle East & North Africa (excluding high income)Middle East & North Africa (IDA & IBRD countries)Middle incomeMoldovaMongoliaMontenegroMoroccoMozambiqueMyanmarNamibiaNauruNepalNetherlandsNew ZealandNicaraguaNigerNigeriaNorwayOECD membersOmanOther small statesPacific island small statesPakistanPalauPanamaPapua New GuineaParaguayPeruPhilippinesPolandPortugalPost-demographic dividendPre-demographic dividendQatarRomaniaRussian FederationRwandaSamoaSan MarinoSao Tome and PrincipeSaudi ArabiaSenegalSerbiaSeychellesSierra LeoneSlovak RepublicSloveniaSmall statesSolomon IslandsSouth AfricaSouth AsiaSouth Asia (IDA & IBRD)South SudanSpainSri LankaSt. Kitts and NevisSt. LuciaSt. Vincent and the GrenadinesSub-Saharan Africa Sub-Saharan Africa (excluding high income)Sub-Saharan Africa (IDA & IBRD countries)SudanSurinameSwazilandSwedenSwitzerlandSyrian Arab RepublicTajikistanTanzaniaThailandTimor-LesteTogoTongaTrinidad and TobagoTunisiaTurkeyTuvaluUgandaUkraineUnited Arab EmiratesUpper middle incomeUruguayUzbekistanVanuatuVenezuela, RBVietnamWest Bank and GazaWorldYemen, Rep.ZambiaZimbabwe Linha do tempo:
Nesta escala de tempo está apresentado um gráfico de 1972 ano até 2013 ano Japan. Dados de 1971 ano ausente. O número de observações reais por data: 37.
Fonte (nome):
Indicadores de desenvolvimento mundial
Fonte (organização):
United Nations Educational, Scientific, and Cultural Organization (UNESCO) Institute for Statistics.
Categorias:
Education, Gender
Foi atualizado:
23 abr 2017 ano
Indicadores de alterações dos valores ao longo dos anos
Mínimo:
90.614
1 jan 1980 ano
Máximo:
105.72
1 jan 1981 ano
Na data de observação
Valor
Mudança absoluta
A alteração em relação ao valor anterior
1 jan 1972 ano
105.14
+105.14
0.0%
1 jan 1973 ano
100.986
-4.155
-3.95%
1 jan 1974 ano
98.674
-2.311
-2.29%
1 jan 1975 ano
98.134
-0.54
-0.55%
1 jan 1976 ano
97.872
-0.262
-0.27%
1 jan 1977 ano
98.358
+0.486
0.5%
1 jan 1978 ano
102.595
+4.237
4.31%
1 jan 1979 ano
98.567
-4.028
-3.93%
1 jan 1980 ano
90.614
-7.953
-8.07%
1 jan 1981 ano
105.72
+15.107
16.67%
1 jan 1982 ano
104.177
-1.544
-1.46%
1 jan 1983 ano
99.41
-4.767
-4.58%
1 jan 1984 ano
98.59
-0.819
-0.82%
1 jan 1985 ano
99.101
+0.51
0.52%
1 jan 1986 ano
99.343
+0.242
0.24%
1 jan 1987 ano
101.29
+1.946
1.96%
1 jan 1988 ano
102.594
+1.305
1.29%
1 jan 1989 ano
100.629
-1.965
-1.92%
1 jan 1990 ano
100.836
+0.207
0.21%
1 jan 1991 ano
103.277
+2.441
2.42%
1 jan 1992 ano
103.256
-0.02
-0.02%
1 jan 1993 ano
101.131
-2.125
-2.06%
1 jan 1995 ano
98.961
-2.17
-2.15%
1 jan 1999 ano
103.123
+4.161
4.21%
1 jan 2000 ano
102.68
-0.443
-0.43%
1 jan 2001 ano
102.482
-0.198
-0.19%
1 jan 2002 ano
102.644
+0.162
0.16%
1 jan 2003 ano
99.462
-3.182
-3.1%
1 jan 2004 ano
98.918
-0.543
-0.55%
1 jan 2005 ano
101.065
+2.146
2.17%
1 jan 2006 ano
101.178
+0.114
0.11%
1 jan 2007 ano
100.903
-0.275
-0.27%
1 jan 2008 ano
104.326
+3.423
3.39%
1 jan 2010 ano
101.427
-2.899
-2.78%
1 jan 2011 ano
100.464
-0.963
-0.95%
1 jan 2012 ano
102.022
+1.558
1.55%
1 jan 2013 ano
102.151
+0.129
0.13%
Classificação de países por estatísticas atuais por anos


Comentários: