30
/pt/
AIzaSyAYiBZKx7MnpbEhh9jyipgxe19OcubqV5w
April 1, 2024
110271
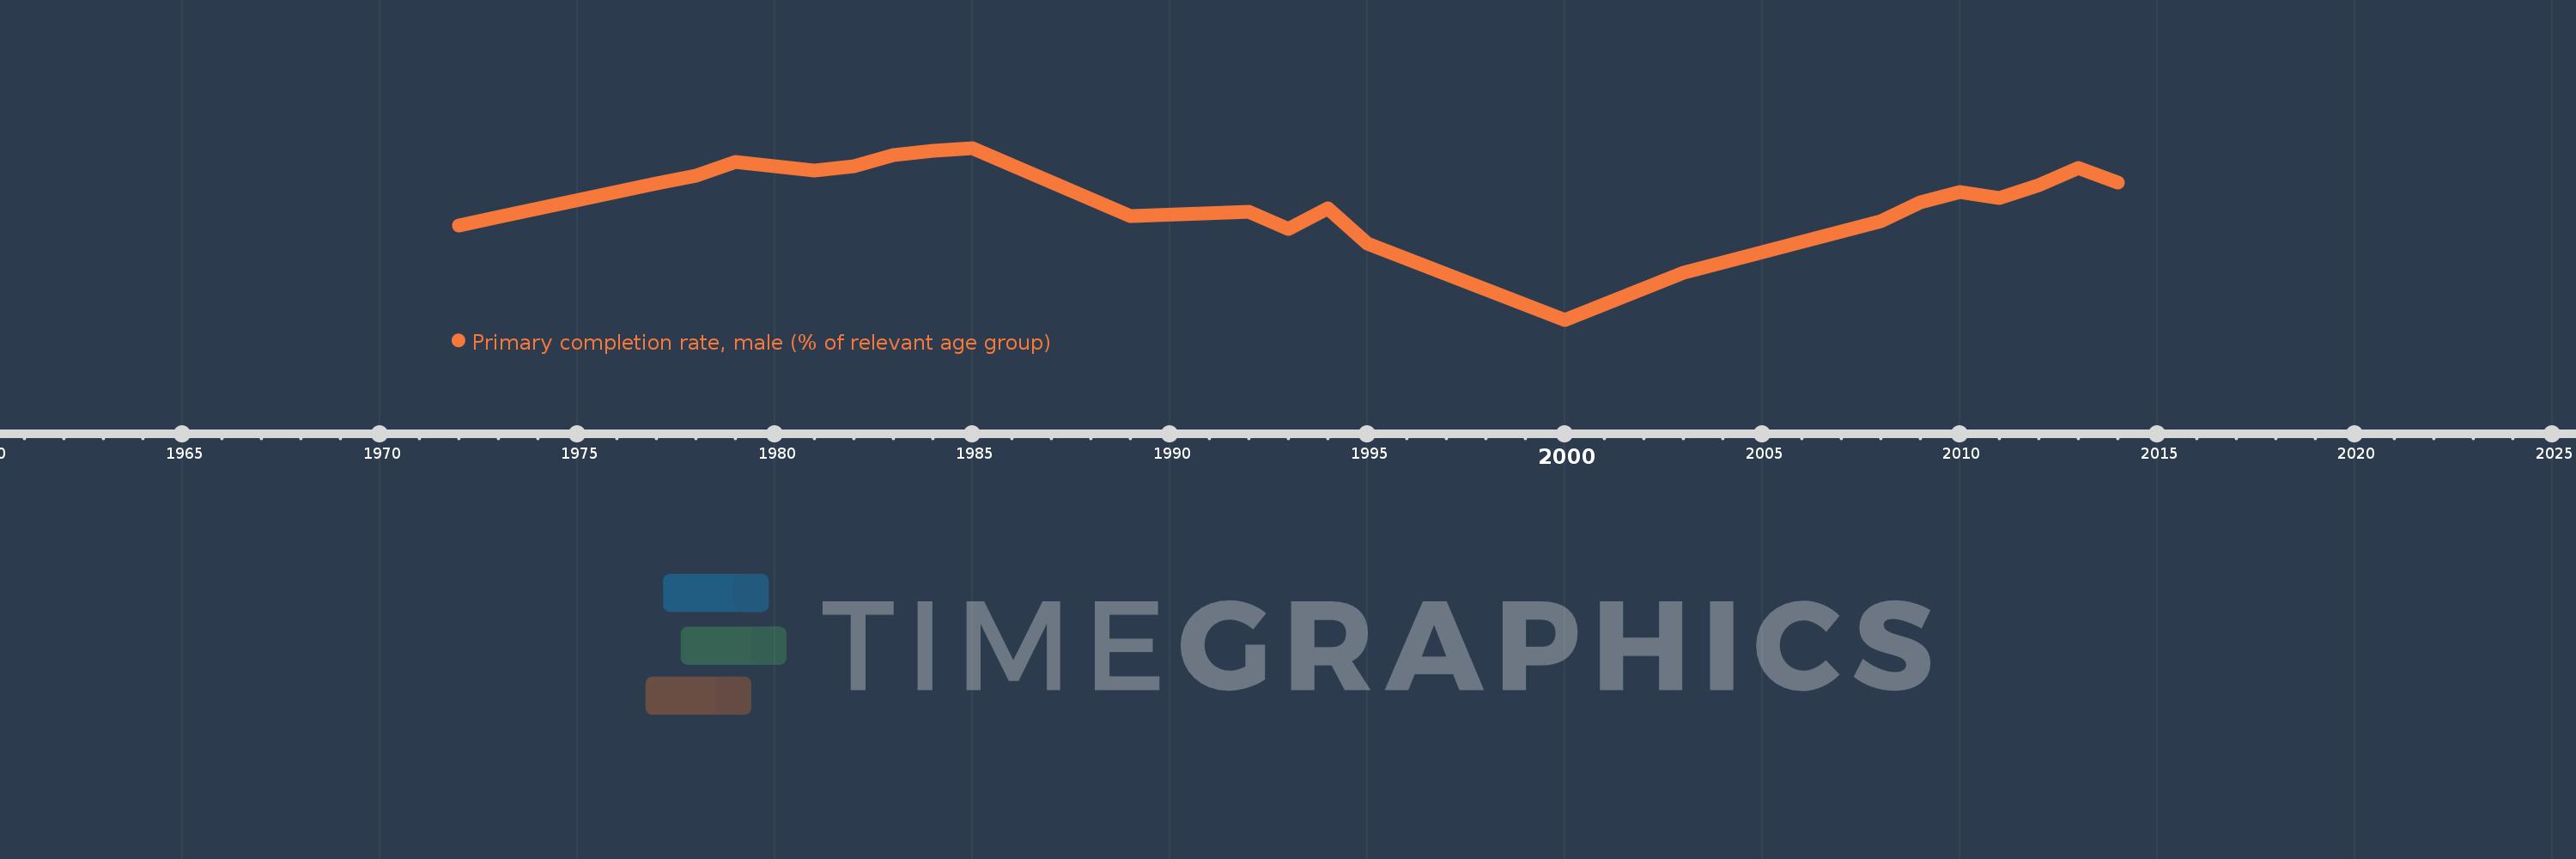
Congo, Dem. Rep.
COD
true
2
1
Primary completion rate, male (% of relevant age group)
2014,2013,2012,2011,2010,2009,2008,2003,2000,1995,1994,1993,1992,1989,1985,1984,1983,1982,1981,1979,1978,1977,1973,1972
