29
/pt/
pt
AIzaSyAYiBZKx7MnpbEhh9jyipgxe19OcubqV5w
April 1, 2024
38533
IDA blend
IDB
false
2
1
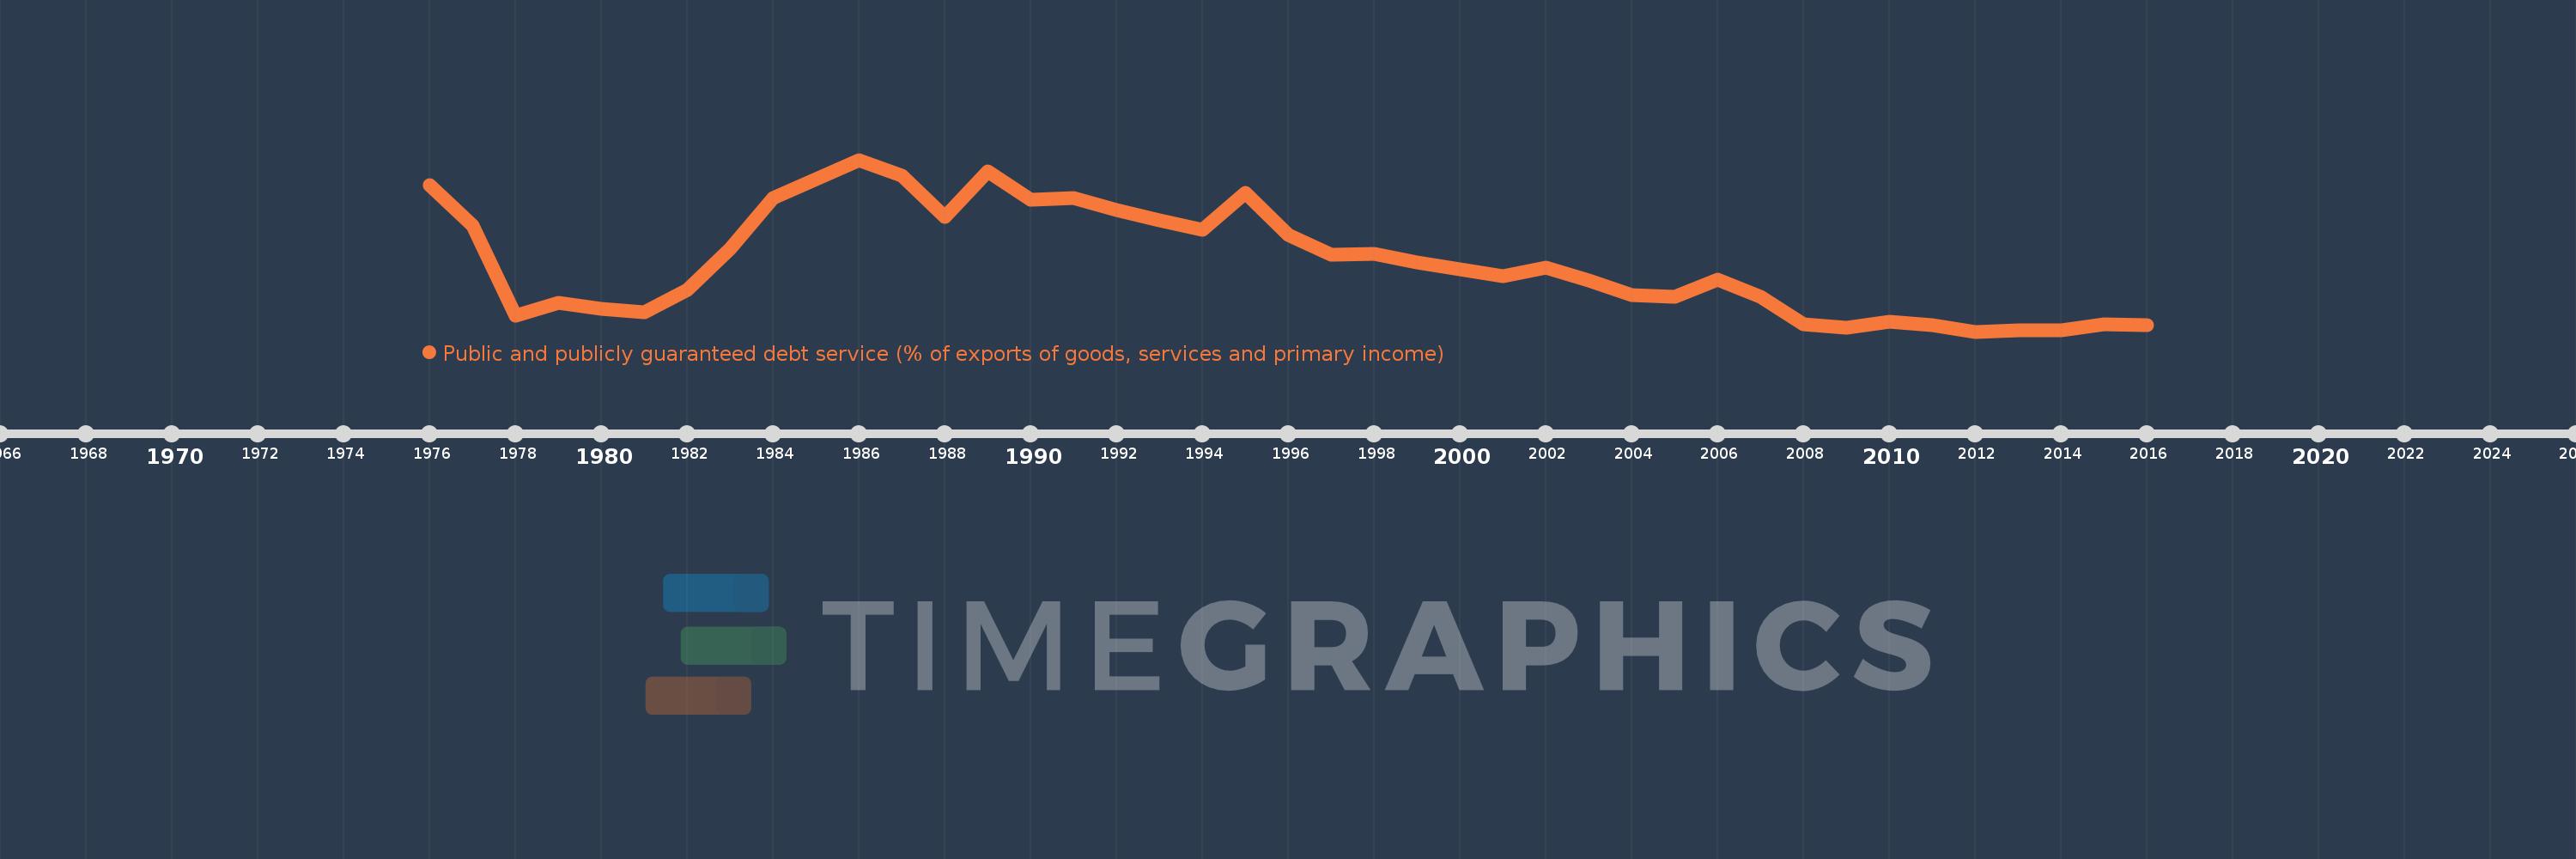
Public and publicly guaranteed debt service (% of exports of goods, services and primary income)
2016,2015,2014,2013,2012,2011,2010,2009,2008,2007,2006,2005,2004,2003,2002,2001,2000,1999,1998,1997,1996,1995,1994,1993,1992,1991,1990,1989,1988,1987,1986,1985,1984,1983,1982,1981,1980,1979,1978,1977,1976
Estas estatísticas em outros países:
Linha do tempo:
Nesta escala de tempo está apresentado um gráfico de 1976 ano até 2016 ano IDA blend. Dados de 1975 ano ausente. O número de observações reais por data: 41.
Fonte (nome):
Indicadores de desenvolvimento mundial
Fonte (organização):
World Bank.
Categorias:
External Debt
Foi atualizado:
23 abr 2017 ano
Indicadores de alterações dos valores ao longo dos anos
Mínimo:
2.118
1 jan 2012 ano
Máximo:
25.053
1 jan 1986 ano
Na data de observação
Valor
Mudança absoluta
A alteração em relação ao valor anterior
1 jan 1976 ano
21.668
+21.668
0.0%
1 jan 1977 ano
16.323
-5.345
-24.67%
1 jan 1978 ano
4.274
-12.049
-73.82%
1 jan 1979 ano
5.906
+1.632
38.19%
1 jan 1980 ano
5.144
-0.762
-12.91%
1 jan 1981 ano
4.672
-0.472
-9.17%
1 jan 1982 ano
7.654
+2.982
63.84%
1 jan 1983 ano
13.136
+5.481
71.61%
1 jan 1984 ano
19.974
+6.838
52.06%
1 jan 1985 ano
22.516
+2.542
12.73%
1 jan 1986 ano
25.053
+2.537
11.27%
1 jan 1987 ano
22.974
-2.079
-8.3%
1 jan 1988 ano
17.407
-5.567
-24.23%
1 jan 1989 ano
23.559
+6.152
35.34%
1 jan 1990 ano
19.681
-3.878
-16.46%
1 jan 1991 ano
19.989
+0.308
1.57%
1 jan 1992 ano
18.317
-1.672
-8.36%
1 jan 1993 ano
16.983
-1.334
-7.28%
1 jan 1994 ano
15.709
-1.274
-7.5%
1 jan 1995 ano
20.603
+4.895
31.16%
1 jan 1996 ano
15.051
-5.552
-26.95%
1 jan 1997 ano
12.406
-2.645
-17.57%
1 jan 1998 ano
12.451
+0.045
0.36%
1 jan 1999 ano
11.389
-1.062
-8.53%
1 jan 2000 ano
10.452
-0.937
-8.23%
1 jan 2001 ano
9.491
-0.961
-9.19%
1 jan 2002 ano
10.643
+1.151
12.13%
1 jan 2003 ano
8.899
-1.744
-16.38%
1 jan 2004 ano
6.991
-1.908
-21.44%
1 jan 2005 ano
6.757
-0.233
-3.34%
1 jan 2006 ano
9.074
+2.316
34.28%
1 jan 2007 ano
6.786
-2.288
-25.22%
1 jan 2008 ano
3.075
-3.71
-54.68%
1 jan 2009 ano
2.636
-0.439
-14.29%
1 jan 2010 ano
3.456
+0.82
31.11%
1 jan 2011 ano
2.953
-0.503
-14.55%
1 jan 2012 ano
2.118
-0.835
-28.27%
1 jan 2013 ano
2.341
+0.223
10.55%
1 jan 2014 ano
2.332
-0.01
-0.41%
1 jan 2015 ano
3.075
+0.743
31.85%
1 jan 2016 ano
2.921
-0.154
-5.0%
Classificação de países por estatísticas atuais por anos


Comentários: