29
/pt/
pt
AIzaSyAYiBZKx7MnpbEhh9jyipgxe19OcubqV5w
April 1, 2024
274230
Ukraine
UKR
true
2
1
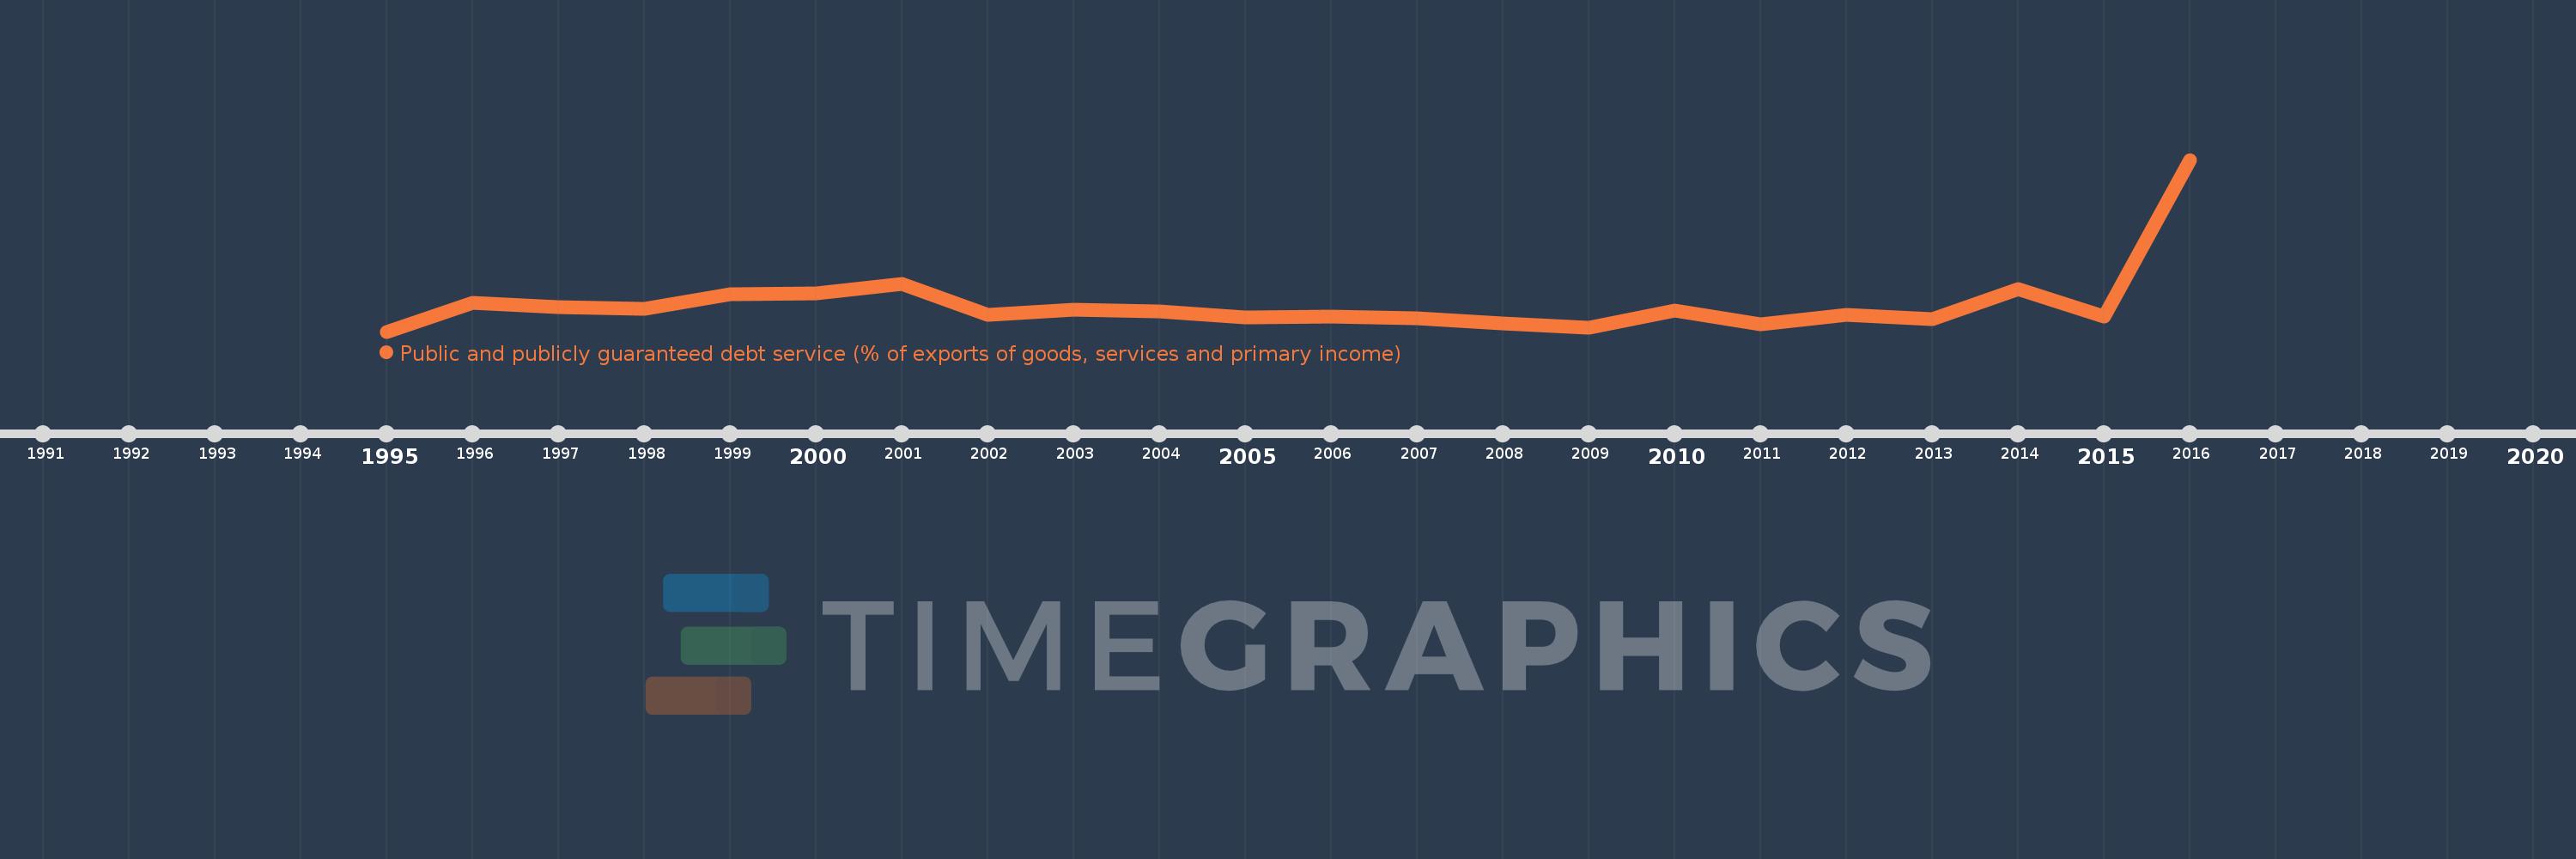
Public and publicly guaranteed debt service (% of exports of goods, services and primary income)
2016,2015,2014,2013,2012,2011,2010,2009,2008,2007,2006,2005,2004,2003,2002,2001,2000,1999,1998,1997,1996,1995
Estas estatísticas em outros países:
Linha do tempo:
Nesta escala de tempo está apresentado um gráfico de 1995 ano até 2016 ano Ukraine. Dados de 1994 ano ausente. O número de observações reais por data: 22.
Fonte (nome):
Indicadores de desenvolvimento mundial
Fonte (organização):
World Bank.
Categorias:
External Debt
Foi atualizado:
23 abr 2017 ano
Indicadores de alterações dos valores ao longo dos anos
Mínimo:
1.586
1 jan 1995 ano
Máximo:
30.036
1 jan 2016 ano
Na data de observação
Valor
Mudança absoluta
A alteração em relação ao valor anterior
1 jan 1995 ano
1.586
+1.586
0.0%
1 jan 1996 ano
6.357
+4.771
300.72%
1 jan 1997 ano
5.706
-0.651
-10.24%
1 jan 1998 ano
5.355
-0.351
-6.15%
1 jan 1999 ano
7.766
+2.41
45.01%
1 jan 2000 ano
7.91
+0.144
1.85%
1 jan 2001 ano
9.437
+1.528
19.31%
1 jan 2002 ano
4.313
-5.125
-54.3%
1 jan 2003 ano
5.154
+0.842
19.52%
1 jan 2004 ano
4.939
-0.215
-4.18%
1 jan 2005 ano
3.888
-1.051
-21.28%
1 jan 2006 ano
4.134
+0.246
6.31%
1 jan 2007 ano
3.815
-0.319
-7.72%
1 jan 2008 ano
2.906
-0.909
-23.82%
1 jan 2009 ano
2.23
-0.676
-23.26%
1 jan 2010 ano
5.04
+2.81
126.03%
1 jan 2011 ano
2.865
-2.175
-43.16%
1 jan 2012 ano
4.398
+1.532
53.49%
1 jan 2013 ano
3.633
-0.764
-17.38%
1 jan 2014 ano
8.557
+4.924
135.55%
1 jan 2015 ano
4.097
-4.461
-52.13%
1 jan 2016 ano
30.036
+25.94
633.21%
Classificação de países por estatísticas atuais por anos


Comentários: