29
/pt/
pt
AIzaSyAYiBZKx7MnpbEhh9jyipgxe19OcubqV5w
April 1, 2024
141047
Ghana
GHA
true
2
1
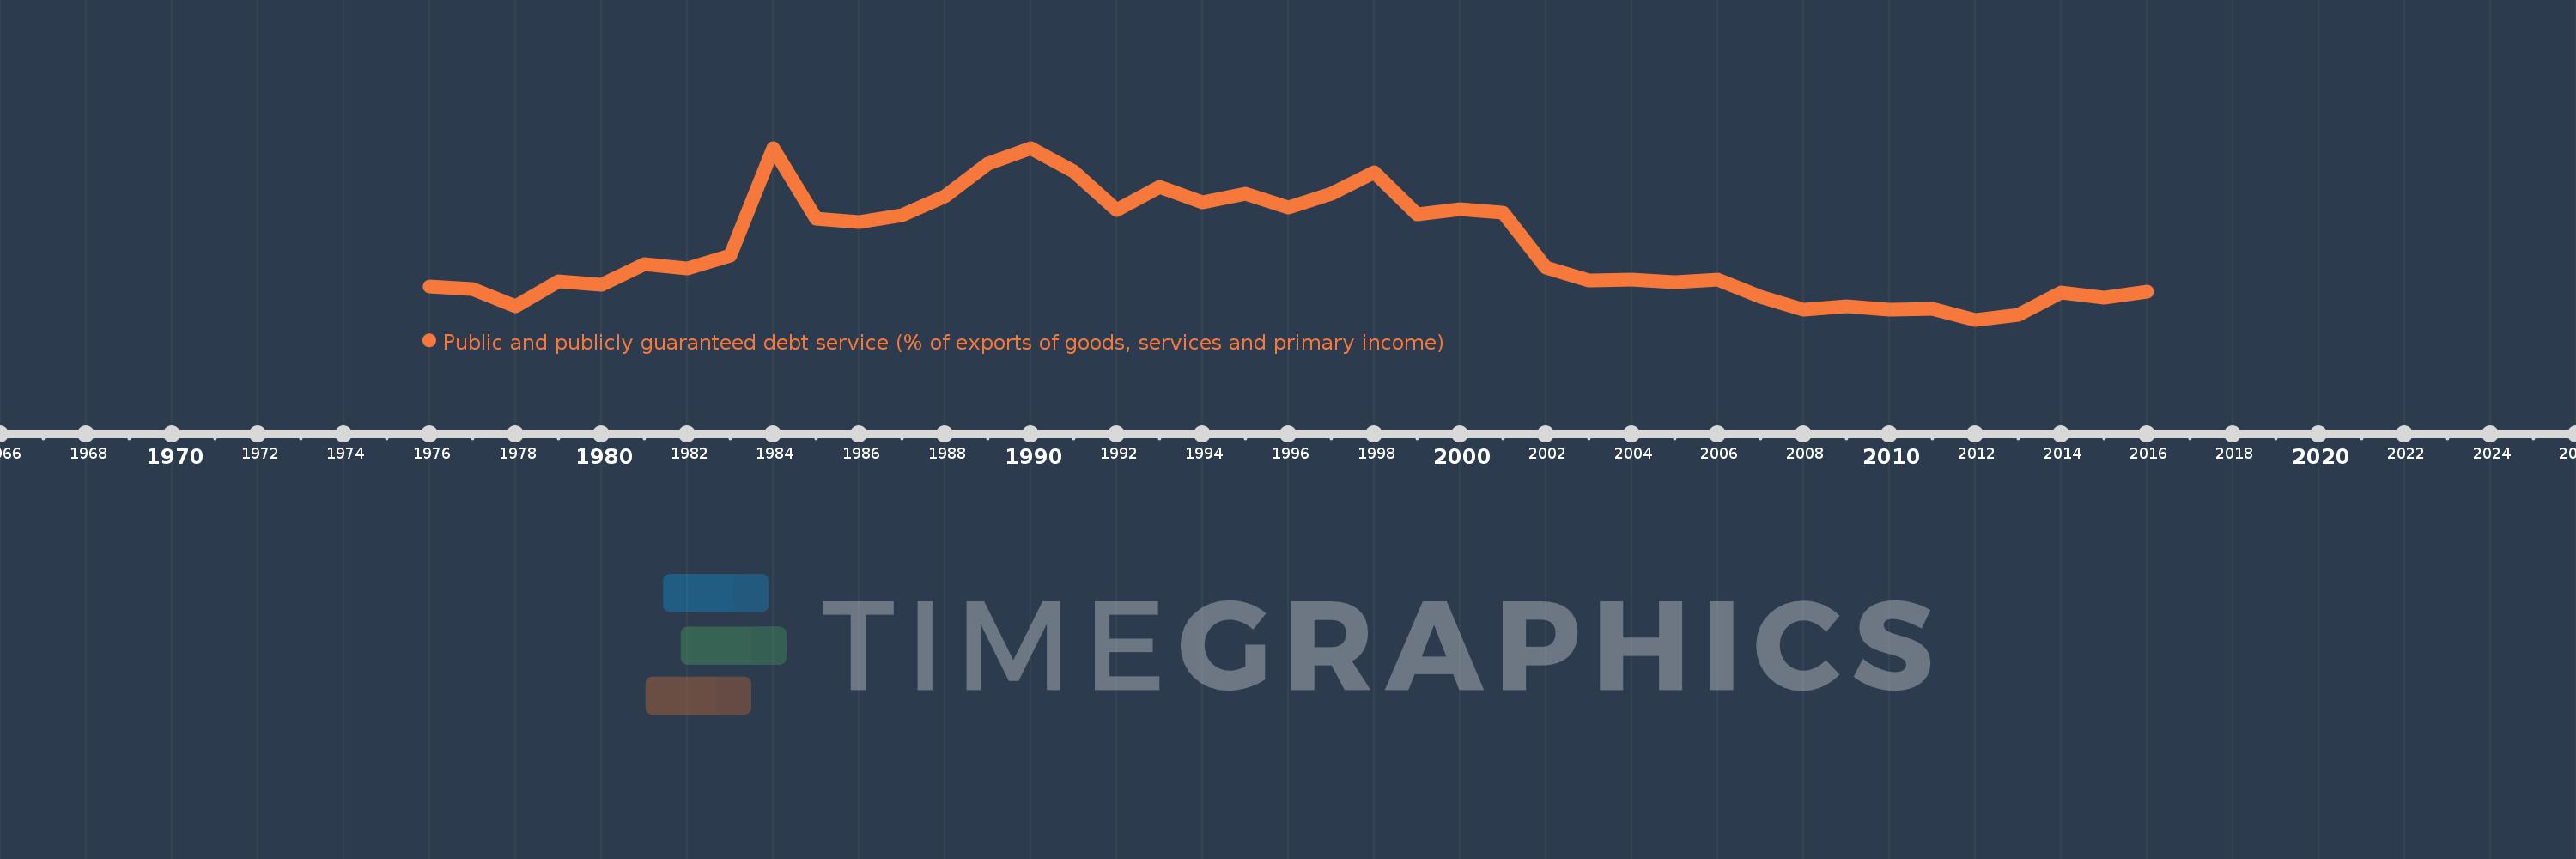
Public and publicly guaranteed debt service (% of exports of goods, services and primary income)
2016,2015,2014,2013,2012,2011,2010,2009,2008,2007,2006,2005,2004,2003,2002,2001,2000,1999,1998,1997,1996,1995,1994,1993,1992,1991,1990,1989,1988,1987,1986,1985,1984,1983,1982,1981,1980,1979,1978,1977,1976
Estas estatísticas em outros países:
Linha do tempo:
Nesta escala de tempo está apresentado um gráfico de 1976 ano até 2016 ano Ghana. Dados de 1975 ano ausente. O número de observações reais por data: 41.
Fonte (nome):
Indicadores de desenvolvimento mundial
Fonte (organização):
World Bank.
Categorias:
External Debt
Foi atualizado:
23 abr 2017 ano
Indicadores de alterações dos valores ao longo dos anos
Mínimo:
2.08
1 jan 2012 ano
Máximo:
23.177
1 jan 1984 ano
Na data de observação
Valor
Mudança absoluta
A alteração em relação ao valor anterior
1 jan 1976 ano
6.124
+6.124
0.0%
1 jan 1977 ano
5.809
-0.315
-5.14%
1 jan 1978 ano
3.715
-2.094
-36.04%
1 jan 1979 ano
6.809
+3.094
83.28%
1 jan 1980 ano
6.342
-0.467
-6.85%
1 jan 1981 ano
8.879
+2.537
39.99%
1 jan 1982 ano
8.325
-0.554
-6.24%
1 jan 1983 ano
9.977
+1.652
19.85%
1 jan 1984 ano
23.177
+13.199
132.3%
1 jan 1985 ano
14.541
-8.636
-37.26%
1 jan 1986 ano
14.091
-0.45
-3.09%
1 jan 1987 ano
14.954
+0.863
6.13%
1 jan 1988 ano
17.246
+2.292
15.33%
1 jan 1989 ano
21.239
+3.993
23.15%
1 jan 1990 ano
23.155
+1.916
9.02%
1 jan 1991 ano
20.276
-2.879
-12.44%
1 jan 1992 ano
15.594
-4.682
-23.09%
1 jan 1993 ano
18.409
+2.815
18.05%
1 jan 1994 ano
16.485
-1.923
-10.45%
1 jan 1995 ano
17.571
+1.086
6.59%
1 jan 1996 ano
15.909
-1.662
-9.46%
1 jan 1997 ano
17.502
+1.594
10.02%
1 jan 1998 ano
20.233
+2.731
15.6%
1 jan 1999 ano
15.02
-5.213
-25.77%
1 jan 2000 ano
15.685
+0.665
4.43%
1 jan 2001 ano
15.241
-0.444
-2.83%
1 jan 2002 ano
8.498
-6.743
-44.24%
1 jan 2003 ano
6.947
-1.551
-18.25%
1 jan 2004 ano
6.958
+0.011
0.16%
1 jan 2005 ano
6.662
-0.297
-4.27%
1 jan 2006 ano
7.015
+0.353
5.3%
1 jan 2007 ano
4.936
-2.079
-29.64%
1 jan 2008 ano
3.289
-1.647
-33.37%
1 jan 2009 ano
3.721
+0.433
13.15%
1 jan 2010 ano
3.262
-0.459
-12.34%
1 jan 2011 ano
3.43
+0.168
5.14%
1 jan 2012 ano
2.08
-1.35
-39.36%
1 jan 2013 ano
2.68
+0.6
28.87%
1 jan 2014 ano
5.421
+2.741
102.25%
1 jan 2015 ano
4.828
-0.594
-10.95%
1 jan 2016 ano
5.485
+0.658
13.63%
Classificação de países por estatísticas atuais por anos


Comentários: