30
/pt/
AIzaSyAYiBZKx7MnpbEhh9jyipgxe19OcubqV5w
April 1, 2024
157888
Iran, Islamic Rep.
IRN
true
2
1
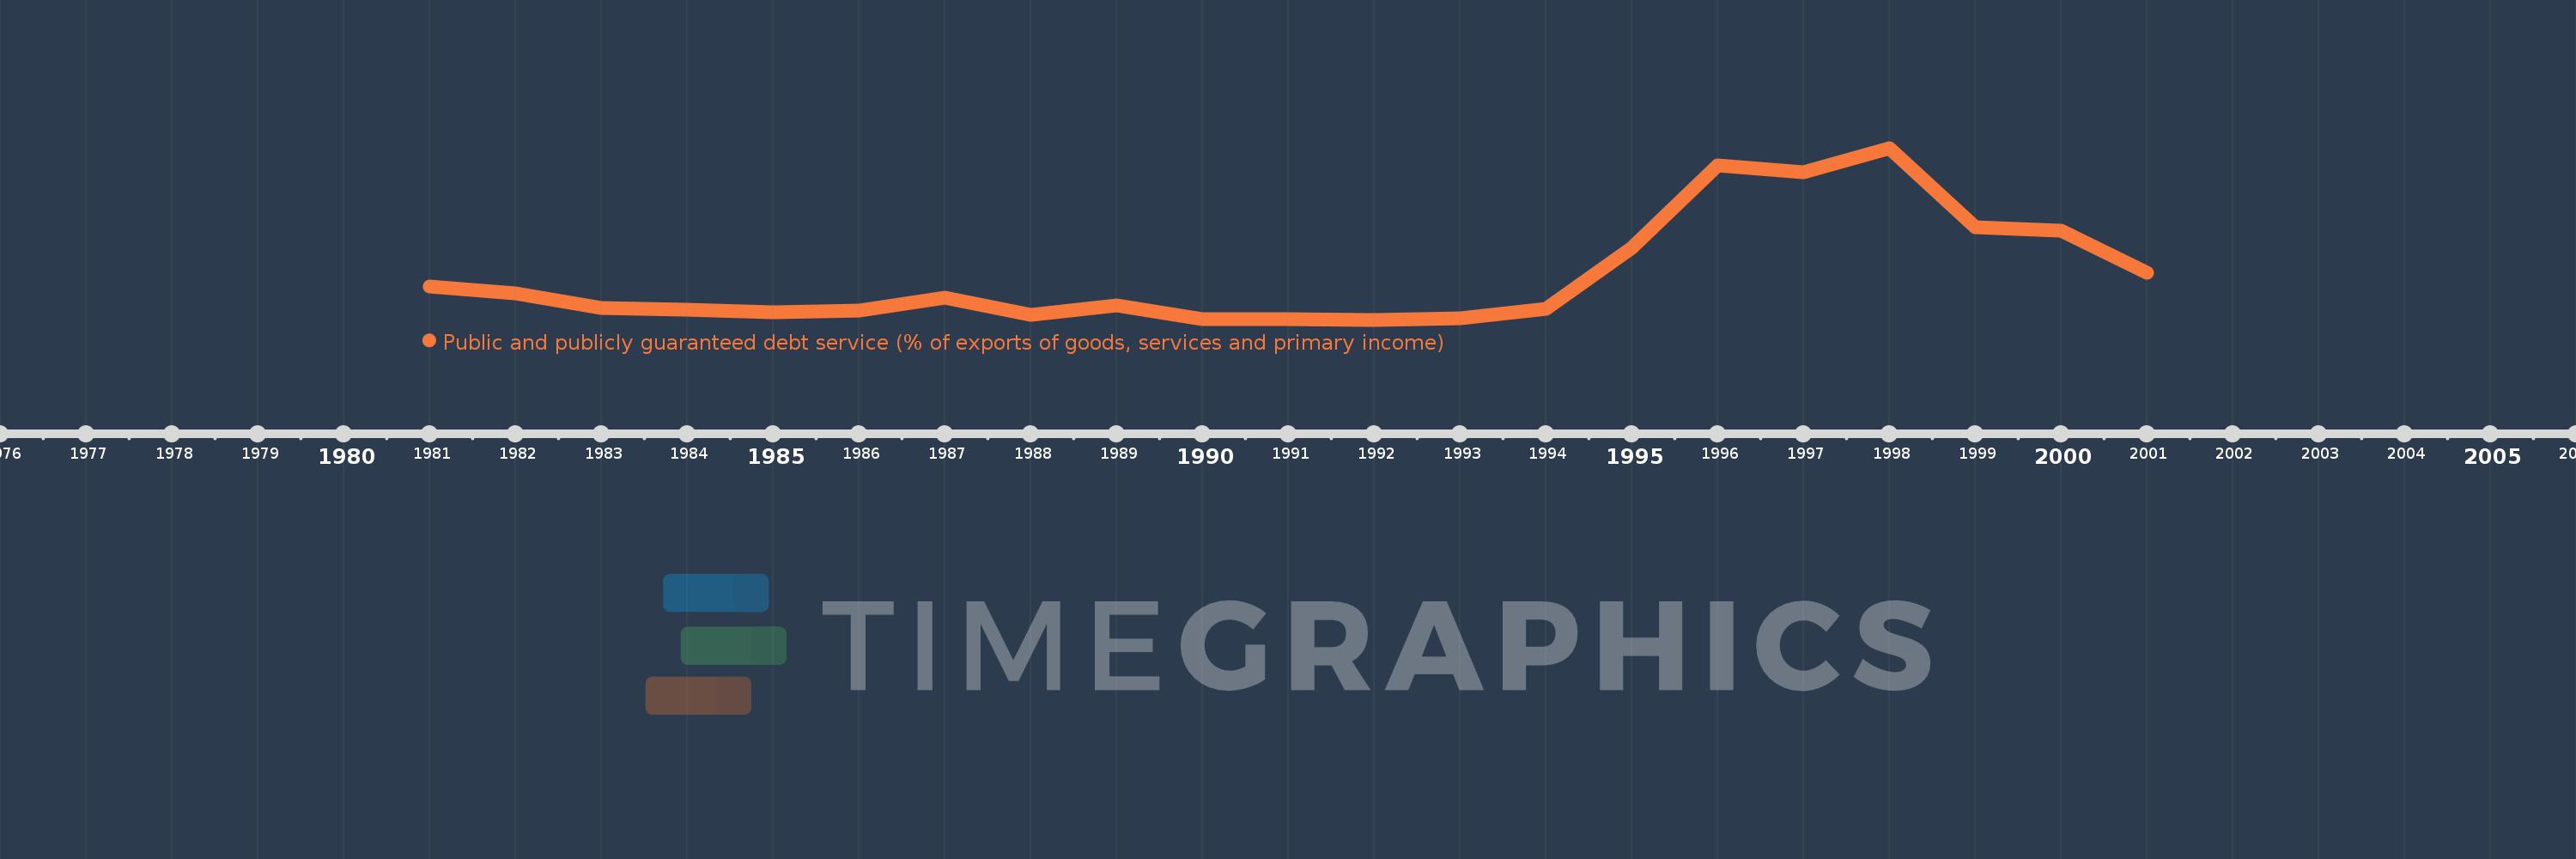
Public and publicly guaranteed debt service (% of exports of goods, services and primary income)
2001,2000,1999,1998,1997,1996,1995,1994,1993,1992,1991,1990,1989,1988,1987,1986,1985,1984,1983,1982,1981
