29
/pt/
pt
AIzaSyAYiBZKx7MnpbEhh9jyipgxe19OcubqV5w
April 1, 2024
35144
Heavily indebted poor countries (HIPC)
HPC
false
2
1
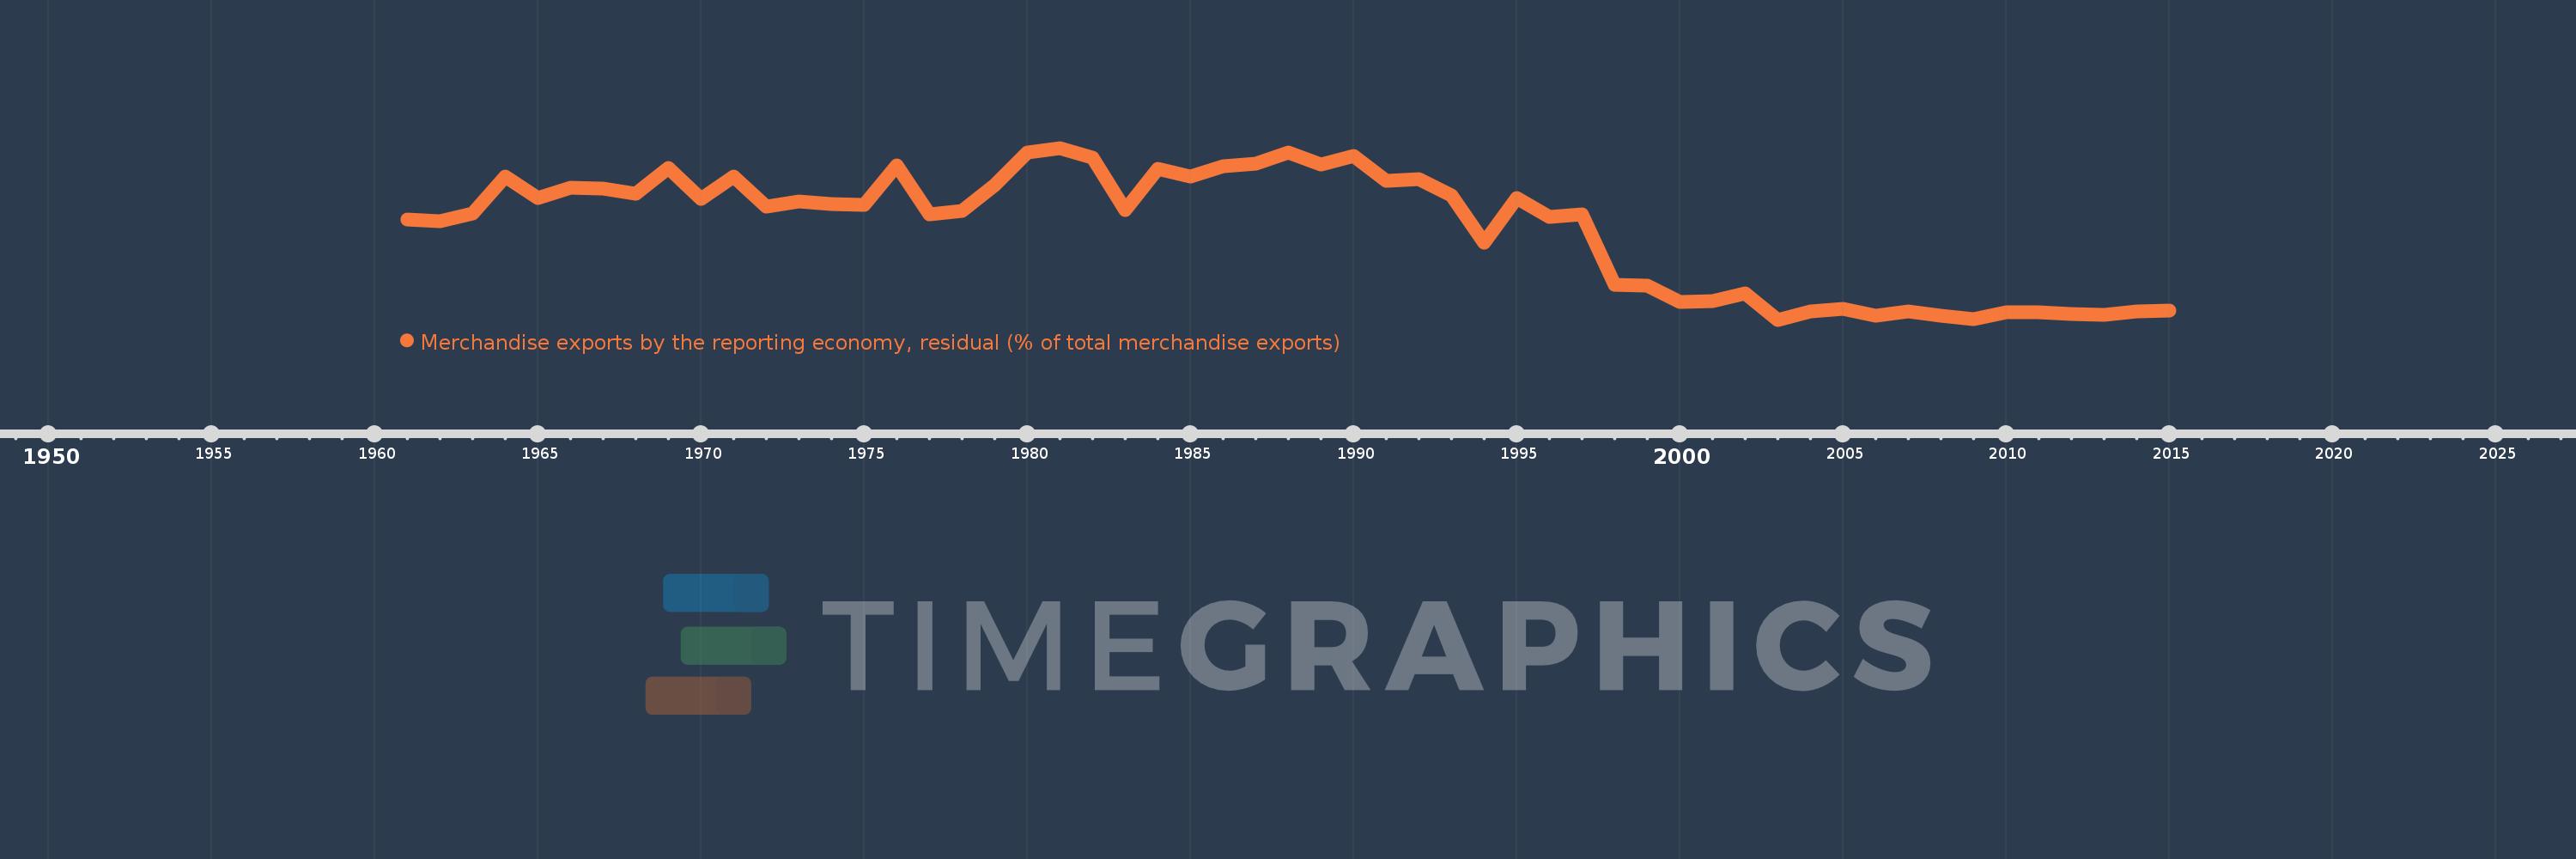
Merchandise exports by the reporting economy, residual (% of total merchandise exports)
2015,2014,2013,2012,2011,2010,2009,2008,2007,2006,2005,2004,2003,2002,2001,2000,1999,1998,1997,1996,1995,1994,1993,1992,1991,1990,1989,1988,1987,1986,1985,1984,1983,1982,1981,1980,1979,1978,1977,1976,1975,1974,1973,1972,1971,1970,1969,1968,1967,1966,1965,1964,1963,1962,1961
Estas estatísticas em outros países:
AfghanistanAlbaniaAlgeriaAmerican SamoaAngolaAntigua and BarbudaArab WorldArgentinaArmeniaArubaAustraliaAustriaAzerbaijanBahamas, TheBahrainBangladeshBarbadosBelarusBelgiumBelizeBeninBermudaBoliviaBosnia and HerzegovinaBrazilBrunei DarussalamBulgariaBurkina FasoBurundiCabo VerdeCambodiaCameroonCanadaCaribbean small statesCentral African RepublicCentral Europe and the BalticsChadChileChinaColombiaComorosCongo, Dem. Rep.Congo, Rep.Costa RicaCote d'IvoireCroatiaCubaCyprusCzech RepublicDenmarkDjiboutiDominicaDominican RepublicEarly-demographic dividendEast Asia & PacificEast Asia & Pacific (excluding high income)East Asia & Pacific (IDA & IBRD countries)EcuadorEgypt, Arab Rep.El SalvadorEquatorial GuineaEstoniaEthiopiaEuro areaEurope & Central AsiaEurope & Central Asia (excluding high income)Europe & Central Asia (IDA & IBRD countries)European UnionFaroe IslandsFijiFinlandFragile and conflict affected situationsFranceFrench PolynesiaGabonGambia, TheGeorgiaGermanyGhanaGibraltarGreeceGreenlandGrenadaGuamGuatemalaGuineaGuinea-BissauGuyanaHaitiHeavily indebted poor countries (HIPC)High incomeHondurasHong Kong SAR, ChinaHungaryIBRD onlyIcelandIDA & IBRD totalIDA blendIDA onlyIDA totalIndiaIndonesiaIran, Islamic Rep.IraqIrelandIsraelItalyJamaicaJapanJordanKazakhstanKenyaKiribatiKorea, Dem. People’s Rep.Korea, Rep.KosovoKuwaitKyrgyz RepublicLao PDRLate-demographic dividendLatin America & Caribbean Latin America & Caribbean (excluding high income)Latin America & the Caribbean (IDA & IBRD countries)LatviaLeast developed countries: UN classificationLebanonLiberiaLibyaLithuaniaLow & middle incomeLow incomeLower middle incomeLuxembourgMacao SAR, ChinaMacedonia, FYRMadagascarMalawiMalaysiaMaldivesMaliMaltaMauritaniaMauritiusMexicoMiddle East & North AfricaMiddle East & North Africa (excluding high income)Middle East & North Africa (IDA & IBRD countries)Middle incomeMoldovaMongoliaMontenegroMoroccoMozambiqueMyanmarNauruNepalNetherlandsNew CaledoniaNew ZealandNicaraguaNigerNigeriaNorth AmericaNorwayOECD membersOmanOther small statesPacific island small statesPakistanPanamaPapua New GuineaParaguayPeruPhilippinesPolandPortugalPost-demographic dividendPre-demographic dividendQatarRomaniaRussian FederationRwandaSamoaSao Tome and PrincipeSaudi ArabiaSenegalSerbiaSeychellesSierra LeoneSingaporeSlovak RepublicSloveniaSmall statesSolomon IslandsSomaliaSouth AfricaSouth AsiaSouth Asia (IDA & IBRD)SpainSri LankaSt. Kitts and NevisSt. LuciaSt. Vincent and the GrenadinesSub-Saharan Africa Sub-Saharan Africa (excluding high income)Sub-Saharan Africa (IDA & IBRD countries)SudanSurinameSwedenSwitzerlandSyrian Arab RepublicTajikistanTanzaniaThailandTogoTongaTrinidad and TobagoTunisiaTurkeyTurkmenistanTuvaluUgandaUkraineUnited Arab EmiratesUnited KingdomUnited StatesUpper middle incomeUruguayUzbekistanVanuatuVenezuela, RBVietnamWorldYemen, Rep.ZambiaZimbabwe Linha do tempo:
Nesta escala de tempo está apresentado um gráfico de 1961 ano até 2015 ano Heavily indebted poor countries (HIPC). Dados de 1960 ano ausente. O número de observações reais por data: 55.
Fonte (nome):
Indicadores de desenvolvimento mundial
Fonte (organização):
World Bank staff estimates based data from International Monetary Fund's Direction of Trade database.
Categorias:
Private Sector, Trade
Foi atualizado:
23 abr 2017 ano
Indicadores de alterações dos valores ao longo dos anos
Mínimo:
3.032
1 jan 2003 ano
Máximo:
21.46
1 jan 1981 ano
Na data de observação
Valor
Mudança absoluta
A alteração em relação ao valor anterior
1 jan 1961 ano
13.812
+13.812
0.0%
1 jan 1962 ano
13.567
-0.245
-1.77%
1 jan 1963 ano
14.43
+0.864
6.37%
1 jan 1964 ano
18.43
+4.0
27.72%
1 jan 1965 ano
16.129
-2.301
-12.49%
1 jan 1966 ano
17.19
+1.061
6.58%
1 jan 1967 ano
17.063
-0.126
-0.74%
1 jan 1968 ano
16.53
-0.534
-3.13%
1 jan 1969 ano
19.28
+2.75
16.64%
1 jan 1970 ano
16.007
-3.272
-16.97%
1 jan 1971 ano
18.437
+2.43
15.18%
1 jan 1972 ano
15.204
-3.233
-17.54%
1 jan 1973 ano
15.75
+0.547
3.6%
1 jan 1974 ano
15.47
-0.28
-1.78%
1 jan 1975 ano
15.37
-0.101
-0.65%
1 jan 1976 ano
19.582
+4.212
27.41%
1 jan 1977 ano
14.322
-5.26
-26.86%
1 jan 1978 ano
14.749
+0.427
2.98%
1 jan 1979 ano
17.47
+2.721
18.45%
1 jan 1980 ano
20.999
+3.529
20.2%
1 jan 1981 ano
21.46
+0.461
2.19%
1 jan 1982 ano
20.409
-1.051
-4.9%
1 jan 1983 ano
14.815
-5.595
-27.41%
1 jan 1984 ano
19.179
+4.365
29.46%
1 jan 1985 ano
18.382
-0.797
-4.16%
1 jan 1986 ano
19.538
+1.156
6.29%
1 jan 1987 ano
19.731
+0.193
0.99%
1 jan 1988 ano
20.96
+1.229
6.23%
1 jan 1989 ano
19.716
-1.244
-5.94%
1 jan 1990 ano
20.608
+0.892
4.53%
1 jan 1991 ano
17.942
-2.666
-12.94%
1 jan 1992 ano
18.071
+0.129
0.72%
1 jan 1993 ano
16.319
-1.752
-9.7%
1 jan 1994 ano
11.325
-4.994
-30.6%
1 jan 1995 ano
16.12
+4.796
42.35%
1 jan 1996 ano
14.065
-2.056
-12.75%
1 jan 1997 ano
14.312
+0.247
1.76%
1 jan 1998 ano
6.803
-7.509
-52.46%
1 jan 1999 ano
6.688
-0.115
-1.7%
1 jan 2000 ano
4.905
-1.783
-26.65%
1 jan 2001 ano
5.025
+0.119
2.43%
1 jan 2002 ano
5.88
+0.856
17.03%
1 jan 2003 ano
3.032
-2.848
-48.44%
1 jan 2004 ano
3.906
+0.874
28.83%
1 jan 2005 ano
4.226
+0.32
8.19%
1 jan 2006 ano
3.458
-0.769
-18.19%
1 jan 2007 ano
3.944
+0.486
14.06%
1 jan 2008 ano
3.467
-0.476
-12.08%
1 jan 2009 ano
3.108
-0.359
-10.35%
1 jan 2010 ano
3.813
+0.705
22.67%
1 jan 2011 ano
3.845
+0.032
0.84%
1 jan 2012 ano
3.638
-0.207
-5.39%
1 jan 2013 ano
3.537
-0.101
-2.78%
1 jan 2014 ano
3.934
+0.398
11.24%
1 jan 2015 ano
4.046
+0.112
2.84%
Classificação de países por estatísticas atuais por anos


Comentários: