29
/pt/
pt
AIzaSyAYiBZKx7MnpbEhh9jyipgxe19OcubqV5w
April 1, 2024
286159
Zambia
ZMB
true
2
1
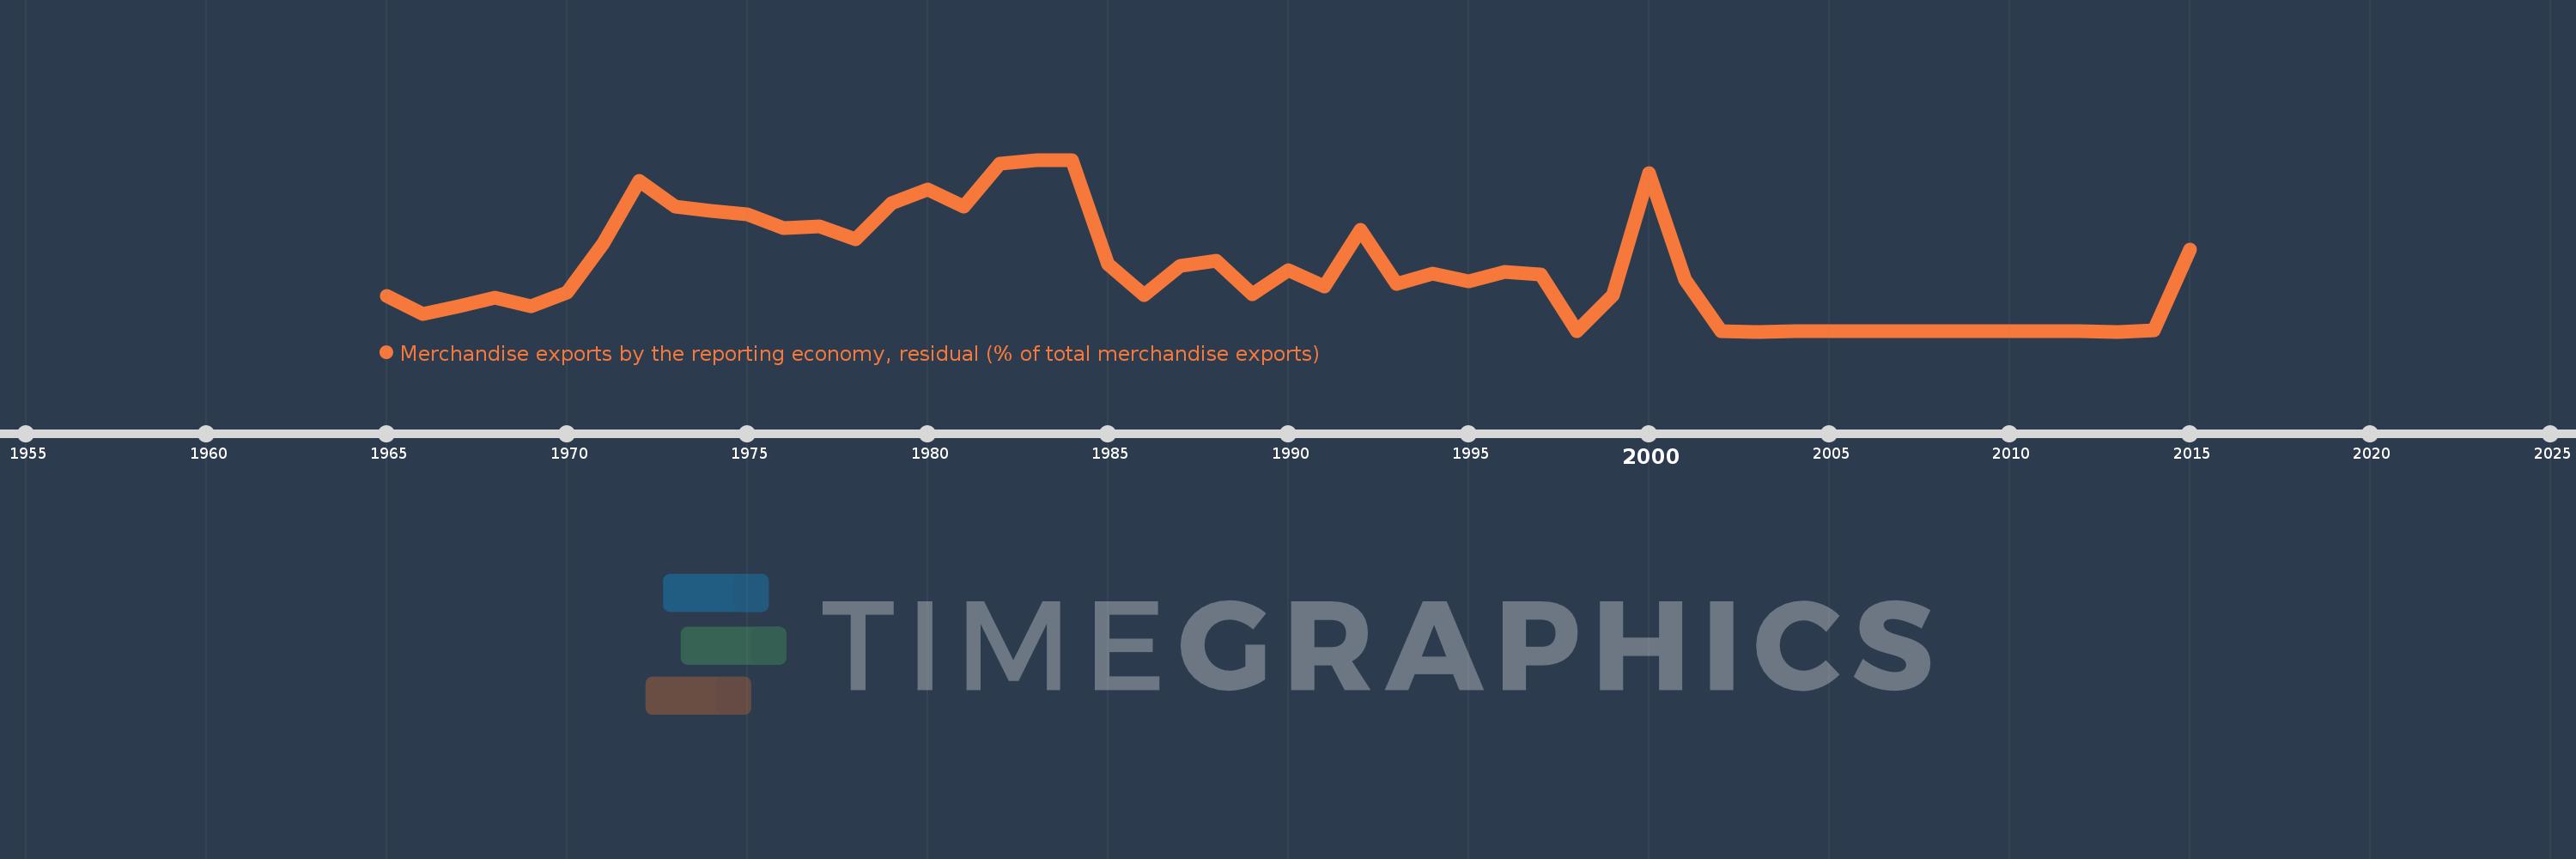
Merchandise exports by the reporting economy, residual (% of total merchandise exports)
2015,2014,2013,2012,2011,2010,2009,2008,2007,2006,2005,2004,2003,2002,2001,2000,1999,1998,1997,1996,1995,1994,1993,1992,1991,1990,1989,1988,1987,1986,1985,1984,1983,1982,1981,1980,1979,1978,1977,1976,1975,1974,1973,1972,1971,1970,1969,1968,1967,1966,1965
Estas estatísticas em outros países:
AfghanistanAlbaniaAlgeriaAmerican SamoaAngolaAntigua and BarbudaArab WorldArgentinaArmeniaArubaAustraliaAustriaAzerbaijanBahamas, TheBahrainBangladeshBarbadosBelarusBelgiumBelizeBeninBermudaBoliviaBosnia and HerzegovinaBrazilBrunei DarussalamBulgariaBurkina FasoBurundiCabo VerdeCambodiaCameroonCanadaCaribbean small statesCentral African RepublicCentral Europe and the BalticsChadChileChinaColombiaComorosCongo, Dem. Rep.Congo, Rep.Costa RicaCote d'IvoireCroatiaCubaCyprusCzech RepublicDenmarkDjiboutiDominicaDominican RepublicEarly-demographic dividendEast Asia & PacificEast Asia & Pacific (excluding high income)East Asia & Pacific (IDA & IBRD countries)EcuadorEgypt, Arab Rep.El SalvadorEquatorial GuineaEstoniaEthiopiaEuro areaEurope & Central AsiaEurope & Central Asia (excluding high income)Europe & Central Asia (IDA & IBRD countries)European UnionFaroe IslandsFijiFinlandFragile and conflict affected situationsFranceFrench PolynesiaGabonGambia, TheGeorgiaGermanyGhanaGibraltarGreeceGreenlandGrenadaGuamGuatemalaGuineaGuinea-BissauGuyanaHaitiHeavily indebted poor countries (HIPC)High incomeHondurasHong Kong SAR, ChinaHungaryIBRD onlyIcelandIDA & IBRD totalIDA blendIDA onlyIDA totalIndiaIndonesiaIran, Islamic Rep.IraqIrelandIsraelItalyJamaicaJapanJordanKazakhstanKenyaKiribatiKorea, Dem. People’s Rep.Korea, Rep.KosovoKuwaitKyrgyz RepublicLao PDRLate-demographic dividendLatin America & Caribbean Latin America & Caribbean (excluding high income)Latin America & the Caribbean (IDA & IBRD countries)LatviaLeast developed countries: UN classificationLebanonLiberiaLibyaLithuaniaLow & middle incomeLow incomeLower middle incomeLuxembourgMacao SAR, ChinaMacedonia, FYRMadagascarMalawiMalaysiaMaldivesMaliMaltaMauritaniaMauritiusMexicoMiddle East & North AfricaMiddle East & North Africa (excluding high income)Middle East & North Africa (IDA & IBRD countries)Middle incomeMoldovaMongoliaMontenegroMoroccoMozambiqueMyanmarNauruNepalNetherlandsNew CaledoniaNew ZealandNicaraguaNigerNigeriaNorth AmericaNorwayOECD membersOmanOther small statesPacific island small statesPakistanPanamaPapua New GuineaParaguayPeruPhilippinesPolandPortugalPost-demographic dividendPre-demographic dividendQatarRomaniaRussian FederationRwandaSamoaSao Tome and PrincipeSaudi ArabiaSenegalSerbiaSeychellesSierra LeoneSingaporeSlovak RepublicSloveniaSmall statesSolomon IslandsSomaliaSouth AfricaSouth AsiaSouth Asia (IDA & IBRD)SpainSri LankaSt. Kitts and NevisSt. LuciaSt. Vincent and the GrenadinesSub-Saharan Africa Sub-Saharan Africa (excluding high income)Sub-Saharan Africa (IDA & IBRD countries)SudanSurinameSwedenSwitzerlandSyrian Arab RepublicTajikistanTanzaniaThailandTogoTongaTrinidad and TobagoTunisiaTurkeyTurkmenistanTuvaluUgandaUkraineUnited Arab EmiratesUnited KingdomUnited StatesUpper middle incomeUruguayUzbekistanVanuatuVenezuela, RBVietnamWorldYemen, Rep.ZambiaZimbabwe Linha do tempo:
Nesta escala de tempo está apresentado um gráfico de 1965 ano até 2015 ano Zambia. Dados de 1964 ano ausente. O número de observações reais por data: 51.
Fonte (nome):
Indicadores de desenvolvimento mundial
Fonte (organização):
World Bank staff estimates based data from International Monetary Fund's Direction of Trade database.
Categorias:
Private Sector, Trade
Foi atualizado:
23 abr 2017 ano
Indicadores de alterações dos valores ao longo dos anos
Mínimo:
0.002
1 jan 2013 ano
Máximo:
21.897
1 jan 1983 ano
Na data de observação
Valor
Mudança absoluta
A alteração em relação ao valor anterior
1 jan 1965 ano
4.539
+4.539
0.0%
1 jan 1966 ano
2.2
-2.339
-51.53%
1 jan 1967 ano
3.216
+1.016
46.2%
1 jan 1968 ano
4.324
+1.108
34.45%
1 jan 1969 ano
3.221
-1.104
-25.52%
1 jan 1970 ano
4.931
+1.71
53.1%
1 jan 1971 ano
11.235
+6.304
127.86%
1 jan 1972 ano
19.261
+8.026
71.44%
1 jan 1973 ano
15.972
-3.289
-17.07%
1 jan 1974 ano
15.337
-0.636
-3.98%
1 jan 1975 ano
14.903
-0.434
-2.83%
1 jan 1976 ano
13.167
-1.736
-11.65%
1 jan 1977 ano
13.393
+0.227
1.72%
1 jan 1978 ano
11.803
-1.59
-11.87%
1 jan 1979 ano
16.372
+4.569
38.71%
1 jan 1980 ano
18.166
+1.794
10.96%
1 jan 1981 ano
15.949
-2.216
-12.2%
1 jan 1982 ano
21.393
+5.443
34.13%
1 jan 1983 ano
21.897
+0.505
2.36%
1 jan 1984 ano
21.897
0.0
0.0%
1 jan 1985 ano
8.63
-13.267
-60.59%
1 jan 1986 ano
4.709
-3.921
-45.43%
1 jan 1987 ano
8.367
+3.658
77.69%
1 jan 1988 ano
9.004
+0.637
7.61%
1 jan 1989 ano
4.722
-4.282
-47.56%
1 jan 1990 ano
7.857
+3.135
66.38%
1 jan 1991 ano
5.785
-2.072
-26.37%
1 jan 1992 ano
12.982
+7.197
124.41%
1 jan 1993 ano
6.044
-6.938
-53.44%
1 jan 1994 ano
7.397
+1.353
22.39%
1 jan 1995 ano
6.449
-0.949
-12.83%
1 jan 1996 ano
7.607
+1.158
17.96%
1 jan 1997 ano
7.243
-0.364
-4.78%
1 jan 1998 ano
0.007
-7.236
-99.9%
1 jan 1999 ano
4.678
+4.671
64.8 mil%
1 jan 2000 ano
20.173
+15.495
331.22%
1 jan 2001 ano
6.61
-13.564
-67.24%
1 jan 2002 ano
0.064
-6.545
-99.03%
1 jan 2003 ano
0.002
-0.063
-97.42%
1 jan 2004 ano
0.003
+0.001
72.33%
1 jan 2005 ano
0.008
+0.005
165.56%
1 jan 2006 ano
0.05
+0.043
560.61%
1 jan 2007 ano
0.009
-0.042
-83.05%
1 jan 2008 ano
0.006
-0.003
-32.52%
1 jan 2009 ano
0.011
+0.005
87.92%
1 jan 2010 ano
0.076
+0.065
603.61%
1 jan 2011 ano
0.006
-0.07
-92.64%
1 jan 2012 ano
0.006
+0.001
11.37%
1 jan 2013 ano
0.002
-0.005
-75.67%
1 jan 2014 ano
0.161
+0.16
10.55 mil%
1 jan 2015 ano
10.412
+10.251
6.36 mil%
Classificação de países por estatísticas atuais por anos


Comentários: