29
/pt/
pt
AIzaSyAYiBZKx7MnpbEhh9jyipgxe19OcubqV5w
April 1, 2024
169331
Korea, Dem. People’s Rep.
PRK
true
2
1
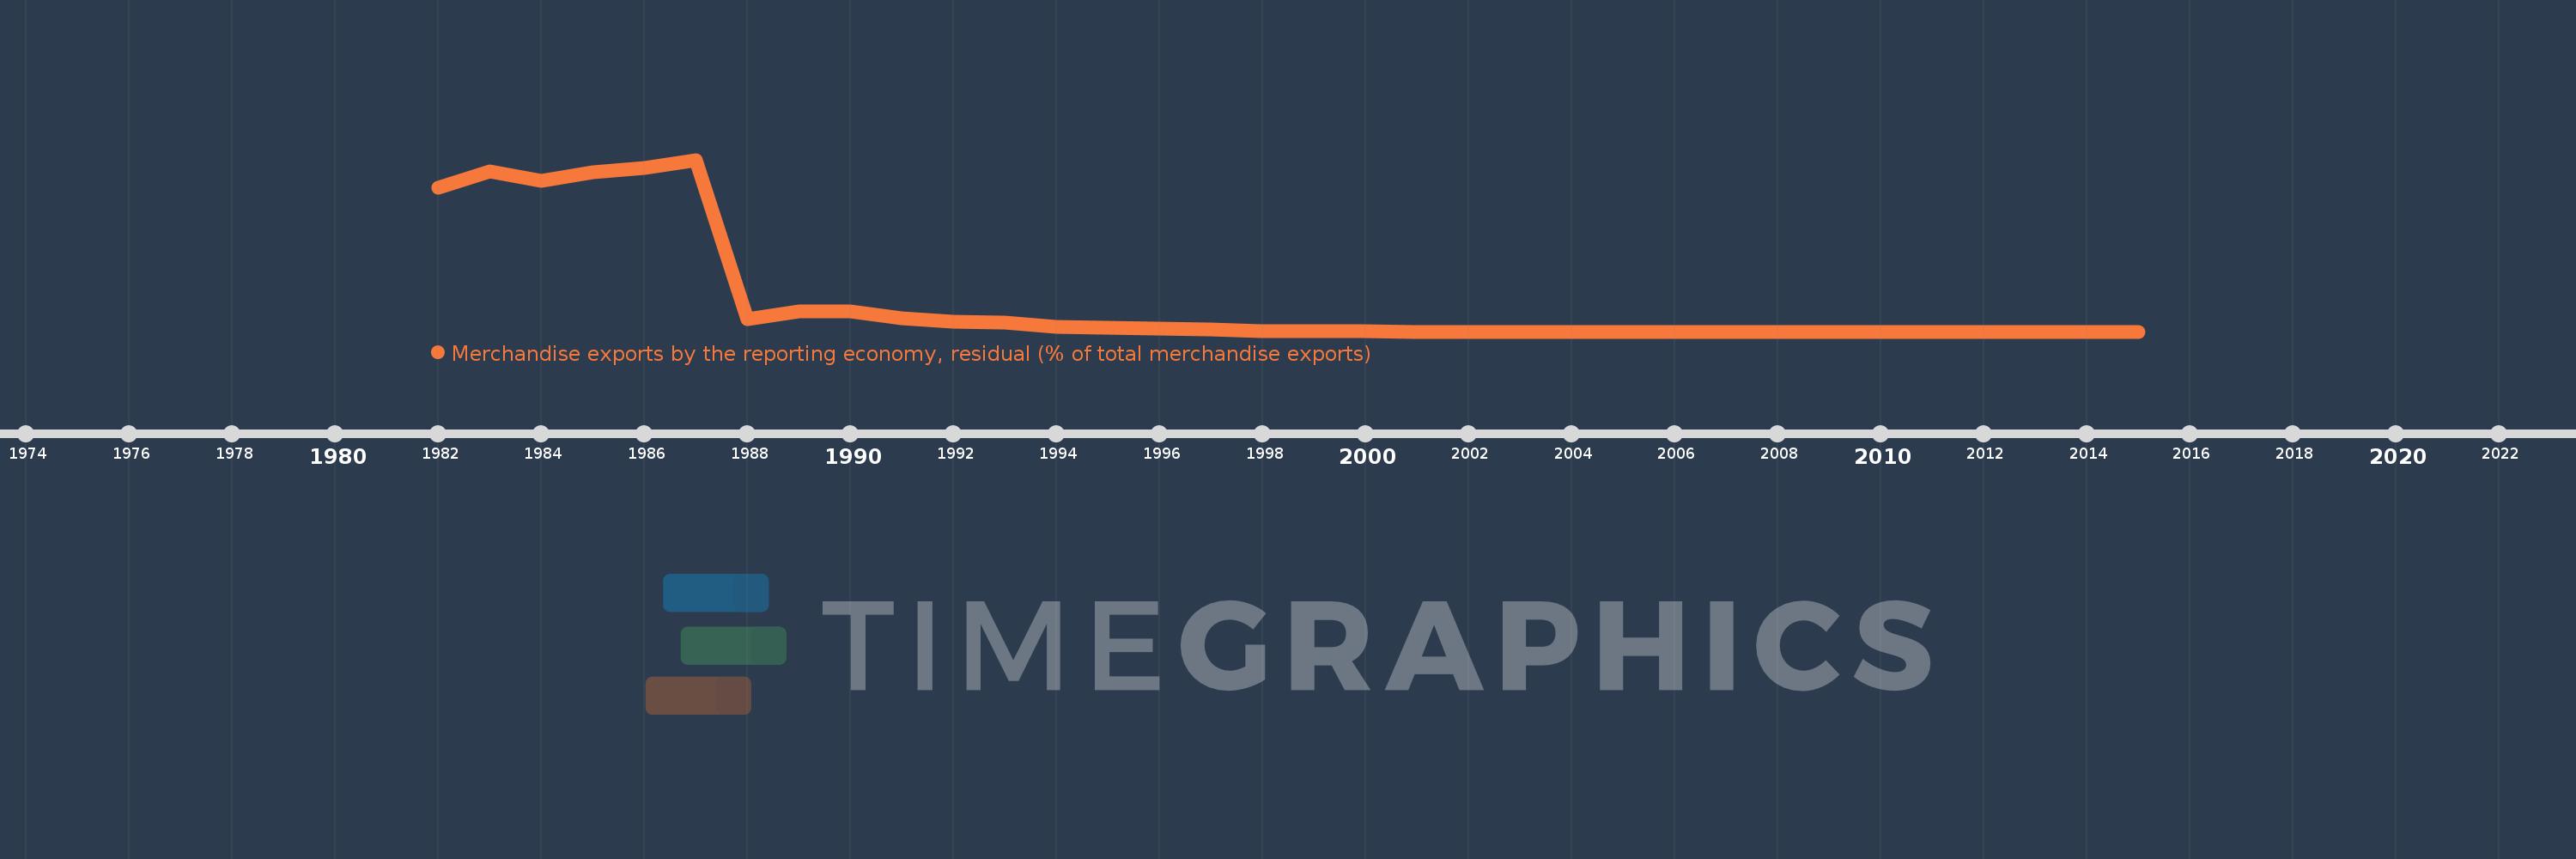
Merchandise exports by the reporting economy, residual (% of total merchandise exports)
2015,2014,2013,2012,2011,2010,2009,2008,2007,2006,2005,2004,2003,2002,2001,2000,1999,1998,1997,1996,1995,1994,1993,1992,1991,1990,1989,1988,1987,1986,1985,1984,1983,1982
Estas estatísticas em outros países:
AfghanistanAlbaniaAlgeriaAmerican SamoaAngolaAntigua and BarbudaArab WorldArgentinaArmeniaArubaAustraliaAustriaAzerbaijanBahamas, TheBahrainBangladeshBarbadosBelarusBelgiumBelizeBeninBermudaBoliviaBosnia and HerzegovinaBrazilBrunei DarussalamBulgariaBurkina FasoBurundiCabo VerdeCambodiaCameroonCanadaCaribbean small statesCentral African RepublicCentral Europe and the BalticsChadChileChinaColombiaComorosCongo, Dem. Rep.Congo, Rep.Costa RicaCote d'IvoireCroatiaCubaCyprusCzech RepublicDenmarkDjiboutiDominicaDominican RepublicEarly-demographic dividendEast Asia & PacificEast Asia & Pacific (excluding high income)East Asia & Pacific (IDA & IBRD countries)EcuadorEgypt, Arab Rep.El SalvadorEquatorial GuineaEstoniaEthiopiaEuro areaEurope & Central AsiaEurope & Central Asia (excluding high income)Europe & Central Asia (IDA & IBRD countries)European UnionFaroe IslandsFijiFinlandFragile and conflict affected situationsFranceFrench PolynesiaGabonGambia, TheGeorgiaGermanyGhanaGibraltarGreeceGreenlandGrenadaGuamGuatemalaGuineaGuinea-BissauGuyanaHaitiHeavily indebted poor countries (HIPC)High incomeHondurasHong Kong SAR, ChinaHungaryIBRD onlyIcelandIDA & IBRD totalIDA blendIDA onlyIDA totalIndiaIndonesiaIran, Islamic Rep.IraqIrelandIsraelItalyJamaicaJapanJordanKazakhstanKenyaKiribatiKorea, Dem. People’s Rep.Korea, Rep.KosovoKuwaitKyrgyz RepublicLao PDRLate-demographic dividendLatin America & Caribbean Latin America & Caribbean (excluding high income)Latin America & the Caribbean (IDA & IBRD countries)LatviaLeast developed countries: UN classificationLebanonLiberiaLibyaLithuaniaLow & middle incomeLow incomeLower middle incomeLuxembourgMacao SAR, ChinaMacedonia, FYRMadagascarMalawiMalaysiaMaldivesMaliMaltaMauritaniaMauritiusMexicoMiddle East & North AfricaMiddle East & North Africa (excluding high income)Middle East & North Africa (IDA & IBRD countries)Middle incomeMoldovaMongoliaMontenegroMoroccoMozambiqueMyanmarNauruNepalNetherlandsNew CaledoniaNew ZealandNicaraguaNigerNigeriaNorth AmericaNorwayOECD membersOmanOther small statesPacific island small statesPakistanPanamaPapua New GuineaParaguayPeruPhilippinesPolandPortugalPost-demographic dividendPre-demographic dividendQatarRomaniaRussian FederationRwandaSamoaSao Tome and PrincipeSaudi ArabiaSenegalSerbiaSeychellesSierra LeoneSingaporeSlovak RepublicSloveniaSmall statesSolomon IslandsSomaliaSouth AfricaSouth AsiaSouth Asia (IDA & IBRD)SpainSri LankaSt. Kitts and NevisSt. LuciaSt. Vincent and the GrenadinesSub-Saharan Africa Sub-Saharan Africa (excluding high income)Sub-Saharan Africa (IDA & IBRD countries)SudanSurinameSwedenSwitzerlandSyrian Arab RepublicTajikistanTanzaniaThailandTogoTongaTrinidad and TobagoTunisiaTurkeyTurkmenistanTuvaluUgandaUkraineUnited Arab EmiratesUnited KingdomUnited StatesUpper middle incomeUruguayUzbekistanVanuatuVenezuela, RBVietnamWorldYemen, Rep.ZambiaZimbabwe Linha do tempo:
Nesta escala de tempo está apresentado um gráfico de 1982 ano até 2015 ano Korea, Dem. People’s Rep.. Dados de 1981 ano ausente. O número de observações reais por data: 34.
Fonte (nome):
Indicadores de desenvolvimento mundial
Fonte (organização):
World Bank staff estimates based data from International Monetary Fund's Direction of Trade database.
Categorias:
Private Sector, Trade
Foi atualizado:
23 abr 2017 ano
Indicadores de alterações dos valores ao longo dos anos
Máximo:
46.125
1 jan 1987 ano
Na data de observação
Valor
Mudança absoluta
A alteração em relação ao valor anterior
1 jan 1982 ano
38.623
+38.623
0.0%
1 jan 1983 ano
43.082
+4.459
11.55%
1 jan 1984 ano
40.49
-2.592
-6.02%
1 jan 1985 ano
42.765
+2.275
5.62%
1 jan 1986 ano
43.945
+1.18
2.76%
1 jan 1987 ano
46.125
+2.179
4.96%
1 jan 1988 ano
3.369
-42.755
-92.7%
1 jan 1989 ano
5.501
+2.132
63.28%
1 jan 1990 ano
5.385
-0.116
-2.11%
1 jan 1991 ano
3.61
-1.775
-32.96%
1 jan 1992 ano
2.589
-1.021
-28.29%
1 jan 1993 ano
2.359
-0.23
-8.89%
1 jan 1994 ano
1.215
-1.143
-48.47%
1 jan 1995 ano
1.083
-0.132
-10.87%
1 jan 1996 ano
0.802
-0.281
-25.97%
1 jan 1997 ano
0.507
-0.295
-36.82%
1 jan 1998 ano
0.002
-0.505
-99.62%
1 jan 1999 ano
0.002
+0.0
14.08%
1 jan 2000 ano
0.003
+0.0
18.72%
1 jan 2001 ano
0.0
-0.003
-100.0%
1 jan 2002 ano
0.0
0.0
-99.97%
1 jan 2003 ano
0.0
0.0
-100.0%
1 jan 2005 ano
0.0
+0.0
-100.0%
1 jan 2007 ano
0.0
0.0
-73.76%
1 jan 2008 ano
0.0
0.0
-5.66%
1 jan 2009 ano
0.0
0.0
-417.09%
1 jan 2010 ano
0.0
+0.0
-205.18%
1 jan 2011 ano
0.0
+0.0
12.62%
1 jan 2012 ano
0.0
0.0
-26.02%
1 jan 2013 ano
0.0
0.0
-173.5%
1 jan 2014 ano
0.0
0.0
9.66%
1 jan 2015 ano
0.0
+0.0
-100.07%
Classificação de países por estatísticas atuais por anos


Comentários: