29
/pt/
pt
AIzaSyAYiBZKx7MnpbEhh9jyipgxe19OcubqV5w
April 1, 2024
208828
New Caledonia
NCL
true
2
1
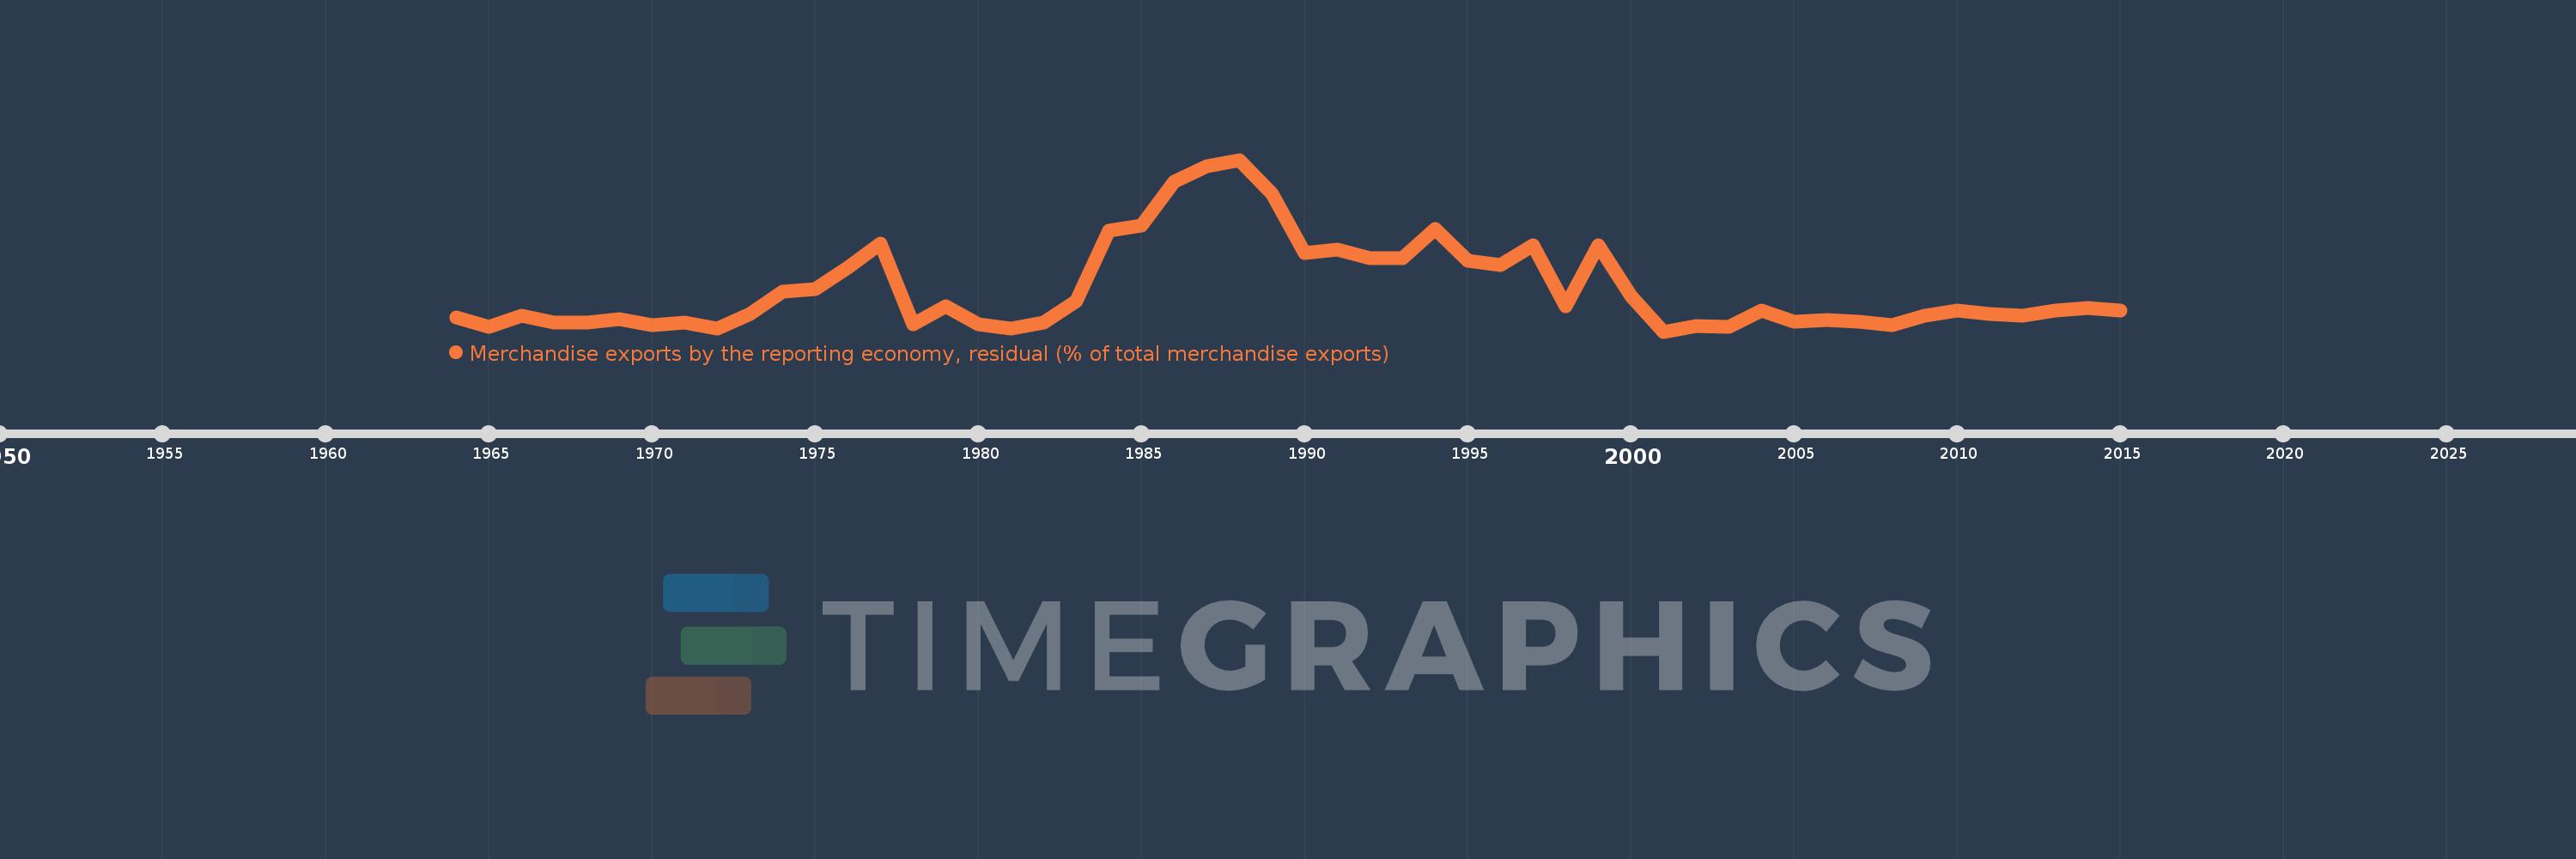
Merchandise exports by the reporting economy, residual (% of total merchandise exports)
2015,2014,2013,2012,2011,2010,2009,2008,2007,2006,2005,2004,2003,2002,2001,2000,1999,1998,1997,1996,1995,1994,1993,1992,1991,1990,1989,1988,1987,1986,1985,1984,1983,1982,1981,1980,1979,1978,1977,1976,1975,1974,1973,1972,1971,1970,1969,1968,1967,1966,1965,1964
Estas estatísticas em outros países:
AfghanistanAlbaniaAlgeriaAmerican SamoaAngolaAntigua and BarbudaArab WorldArgentinaArmeniaArubaAustraliaAustriaAzerbaijanBahamas, TheBahrainBangladeshBarbadosBelarusBelgiumBelizeBeninBermudaBoliviaBosnia and HerzegovinaBrazilBrunei DarussalamBulgariaBurkina FasoBurundiCabo VerdeCambodiaCameroonCanadaCaribbean small statesCentral African RepublicCentral Europe and the BalticsChadChileChinaColombiaComorosCongo, Dem. Rep.Congo, Rep.Costa RicaCote d'IvoireCroatiaCubaCyprusCzech RepublicDenmarkDjiboutiDominicaDominican RepublicEarly-demographic dividendEast Asia & PacificEast Asia & Pacific (excluding high income)East Asia & Pacific (IDA & IBRD countries)EcuadorEgypt, Arab Rep.El SalvadorEquatorial GuineaEstoniaEthiopiaEuro areaEurope & Central AsiaEurope & Central Asia (excluding high income)Europe & Central Asia (IDA & IBRD countries)European UnionFaroe IslandsFijiFinlandFragile and conflict affected situationsFranceFrench PolynesiaGabonGambia, TheGeorgiaGermanyGhanaGibraltarGreeceGreenlandGrenadaGuamGuatemalaGuineaGuinea-BissauGuyanaHaitiHeavily indebted poor countries (HIPC)High incomeHondurasHong Kong SAR, ChinaHungaryIBRD onlyIcelandIDA & IBRD totalIDA blendIDA onlyIDA totalIndiaIndonesiaIran, Islamic Rep.IraqIrelandIsraelItalyJamaicaJapanJordanKazakhstanKenyaKiribatiKorea, Dem. People’s Rep.Korea, Rep.KosovoKuwaitKyrgyz RepublicLao PDRLate-demographic dividendLatin America & Caribbean Latin America & Caribbean (excluding high income)Latin America & the Caribbean (IDA & IBRD countries)LatviaLeast developed countries: UN classificationLebanonLiberiaLibyaLithuaniaLow & middle incomeLow incomeLower middle incomeLuxembourgMacao SAR, ChinaMacedonia, FYRMadagascarMalawiMalaysiaMaldivesMaliMaltaMauritaniaMauritiusMexicoMiddle East & North AfricaMiddle East & North Africa (excluding high income)Middle East & North Africa (IDA & IBRD countries)Middle incomeMoldovaMongoliaMontenegroMoroccoMozambiqueMyanmarNauruNepalNetherlandsNew CaledoniaNew ZealandNicaraguaNigerNigeriaNorth AmericaNorwayOECD membersOmanOther small statesPacific island small statesPakistanPanamaPapua New GuineaParaguayPeruPhilippinesPolandPortugalPost-demographic dividendPre-demographic dividendQatarRomaniaRussian FederationRwandaSamoaSao Tome and PrincipeSaudi ArabiaSenegalSerbiaSeychellesSierra LeoneSingaporeSlovak RepublicSloveniaSmall statesSolomon IslandsSomaliaSouth AfricaSouth AsiaSouth Asia (IDA & IBRD)SpainSri LankaSt. Kitts and NevisSt. LuciaSt. Vincent and the GrenadinesSub-Saharan Africa Sub-Saharan Africa (excluding high income)Sub-Saharan Africa (IDA & IBRD countries)SudanSurinameSwedenSwitzerlandSyrian Arab RepublicTajikistanTanzaniaThailandTogoTongaTrinidad and TobagoTunisiaTurkeyTurkmenistanTuvaluUgandaUkraineUnited Arab EmiratesUnited KingdomUnited StatesUpper middle incomeUruguayUzbekistanVanuatuVenezuela, RBVietnamWorldYemen, Rep.ZambiaZimbabwe Linha do tempo:
Nesta escala de tempo está apresentado um gráfico de 1964 ano até 2015 ano New Caledonia. Dados de 1963 ano ausente. O número de observações reais por data: 52.
Fonte (nome):
Indicadores de desenvolvimento mundial
Fonte (organização):
World Bank staff estimates based data from International Monetary Fund's Direction of Trade database.
Categorias:
Private Sector, Trade
Foi atualizado:
23 abr 2017 ano
Indicadores de alterações dos valores ao longo dos anos
Mínimo:
0.205
1 jan 2001 ano
Máximo:
11.129
1 jan 1988 ano
Na data de observação
Valor
Mudança absoluta
A alteração em relação ao valor anterior
1 jan 1964 ano
1.087
+1.087
0.0%
1 jan 1965 ano
0.482
-0.605
-55.7%
1 jan 1966 ano
1.229
+0.747
155.2%
1 jan 1967 ano
0.773
-0.456
-37.08%
1 jan 1968 ano
0.759
-0.014
-1.77%
1 jan 1969 ano
1.012
+0.253
33.26%
1 jan 1970 ano
0.613
-0.399
-39.4%
1 jan 1971 ano
0.801
+0.187
30.56%
1 jan 1972 ano
0.404
-0.396
-49.49%
1 jan 1973 ano
1.34
+0.935
231.21%
1 jan 1974 ano
2.738
+1.398
104.35%
1 jan 1975 ano
2.916
+0.178
6.51%
1 jan 1976 ano
4.251
+1.335
45.78%
1 jan 1977 ano
5.796
+1.545
36.35%
1 jan 1978 ano
0.671
-5.125
-88.42%
1 jan 1979 ano
1.806
+1.135
169.14%
1 jan 1980 ano
0.674
-1.131
-62.66%
1 jan 1981 ano
0.396
-0.278
-41.24%
1 jan 1982 ano
0.762
+0.365
92.22%
1 jan 1983 ano
2.134
+1.372
180.18%
1 jan 1984 ano
6.648
+4.514
211.51%
1 jan 1985 ano
6.925
+0.277
4.17%
1 jan 1986 ano
9.742
+2.817
40.68%
1 jan 1987 ano
10.717
+0.975
10.01%
1 jan 1988 ano
11.129
+0.412
3.85%
1 jan 1989 ano
8.95
-2.18
-19.59%
1 jan 1990 ano
5.198
-3.752
-41.92%
1 jan 1991 ano
5.424
+0.227
4.36%
1 jan 1992 ano
4.863
-0.561
-10.34%
1 jan 1993 ano
4.862
-0.001
-0.02%
1 jan 1994 ano
6.726
+1.863
38.33%
1 jan 1995 ano
4.706
-2.019
-30.03%
1 jan 1996 ano
4.441
-0.266
-5.64%
1 jan 1997 ano
5.676
+1.236
27.83%
1 jan 1998 ano
1.828
-3.848
-67.79%
1 jan 1999 ano
5.716
+3.887
212.64%
1 jan 2000 ano
2.492
-3.224
-56.4%
1 jan 2001 ano
0.205
-2.287
-91.77%
1 jan 2002 ano
0.557
+0.352
171.83%
1 jan 2003 ano
0.512
-0.045
-8.13%
1 jan 2004 ano
1.516
+1.004
196.16%
1 jan 2005 ano
0.834
-0.683
-45.02%
1 jan 2006 ano
0.956
+0.123
14.7%
1 jan 2007 ano
0.855
-0.101
-10.61%
1 jan 2008 ano
0.615
-0.24
-28.11%
1 jan 2009 ano
1.241
+0.627
101.99%
1 jan 2010 ano
1.549
+0.308
24.82%
1 jan 2011 ano
1.34
-0.209
-13.52%
1 jan 2012 ano
1.196
-0.144
-10.76%
1 jan 2013 ano
1.553
+0.357
29.83%
1 jan 2014 ano
1.703
+0.151
9.72%
1 jan 2015 ano
1.547
-0.157
-9.19%
Classificação de países por estatísticas atuais por anos


Comentários: