29
/pt/
pt
AIzaSyAYiBZKx7MnpbEhh9jyipgxe19OcubqV5w
April 1, 2024
34099
Fragile and conflict affected situations
FCS
false
2
1
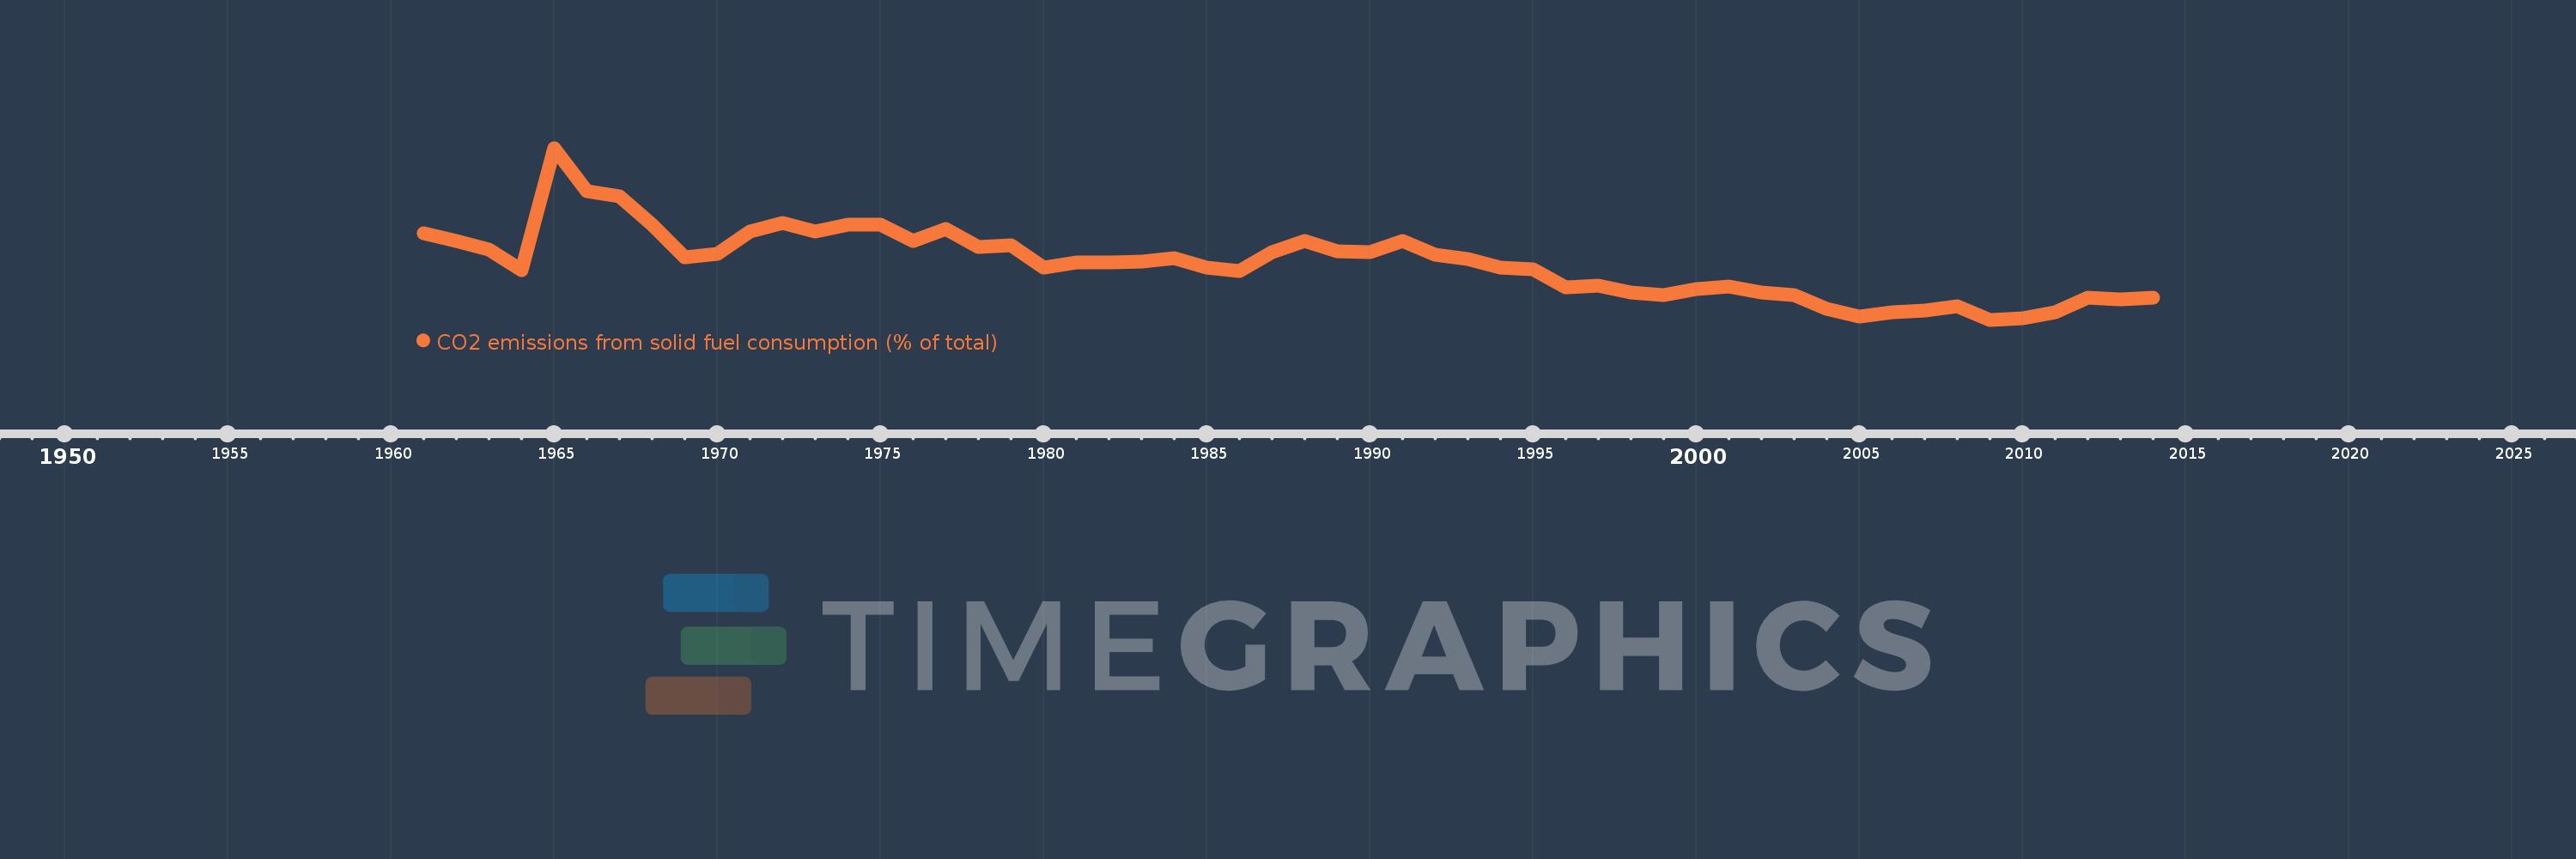
CO2 emissions from solid fuel consumption (% of total)
2014,2013,2012,2011,2010,2009,2008,2007,2006,2005,2004,2003,2002,2001,2000,1999,1998,1997,1996,1995,1994,1993,1992,1991,1990,1989,1988,1987,1986,1985,1984,1983,1982,1981,1980,1979,1978,1977,1976,1975,1974,1973,1972,1971,1970,1969,1968,1967,1966,1965,1964,1963,1962,1961
Estas estatísticas em outros países:
AfghanistanAlbaniaAlgeriaAndorraAngolaAntigua and BarbudaArab WorldArgentinaArmeniaArubaAustraliaAustriaAzerbaijanBahamas, TheBahrainBangladeshBarbadosBelarusBelgiumBelizeBeninBermudaBhutanBoliviaBosnia and HerzegovinaBotswanaBrazilBritish Virgin IslandsBrunei DarussalamBulgariaBurkina FasoBurundiCabo VerdeCambodiaCameroonCanadaCaribbean small statesCayman IslandsCentral African RepublicCentral Europe and the BalticsChadChileChinaColombiaComorosCongo, Dem. Rep.Congo, Rep.Costa RicaCote d'IvoireCroatiaCubaCuracaoCyprusCzech RepublicDenmarkDjiboutiDominicaDominican RepublicEarly-demographic dividendEast Asia & PacificEast Asia & Pacific (excluding high income)East Asia & Pacific (IDA & IBRD countries)EcuadorEgypt, Arab Rep.El SalvadorEquatorial GuineaEritreaEstoniaEthiopiaEuro areaEurope & Central AsiaEurope & Central Asia (excluding high income)Europe & Central Asia (IDA & IBRD countries)European UnionFaroe IslandsFijiFinlandFragile and conflict affected situationsFranceFrench PolynesiaGabonGambia, TheGeorgiaGermanyGhanaGibraltarGreeceGreenlandGrenadaGuatemalaGuineaGuinea-BissauGuyanaHaitiHeavily indebted poor countries (HIPC)High incomeHondurasHong Kong SAR, ChinaHungaryIBRD onlyIcelandIDA & IBRD totalIDA blendIDA onlyIDA totalIndiaIndonesiaIran, Islamic Rep.IraqIrelandIsraelItalyJamaicaJapanJordanKazakhstanKenyaKiribatiKorea, Dem. People’s Rep.Korea, Rep.KuwaitKyrgyz RepublicLao PDRLate-demographic dividendLatin America & Caribbean Latin America & Caribbean (excluding high income)Latin America & the Caribbean (IDA & IBRD countries)LatviaLeast developed countries: UN classificationLebanonLesothoLiberiaLibyaLiechtensteinLithuaniaLow & middle incomeLow incomeLower middle incomeLuxembourgMacao SAR, ChinaMacedonia, FYRMadagascarMalawiMalaysiaMaldivesMaliMaltaMarshall IslandsMauritaniaMauritiusMexicoMicronesia, Fed. Sts.Middle East & North AfricaMiddle East & North Africa (excluding high income)Middle East & North Africa (IDA & IBRD countries)Middle incomeMoldovaMongoliaMontenegroMoroccoMozambiqueMyanmarNamibiaNauruNepalNetherlandsNew CaledoniaNew ZealandNicaraguaNigerNigeriaNorth AmericaNorwayOECD membersOmanOther small statesPacific island small statesPakistanPalauPanamaPapua New GuineaParaguayPeruPhilippinesPolandPortugalPost-demographic dividendPre-demographic dividendQatarRomaniaRussian FederationRwandaSamoaSao Tome and PrincipeSaudi ArabiaSenegalSerbiaSeychellesSierra LeoneSingaporeSint Maarten (Dutch part)Slovak RepublicSloveniaSmall statesSolomon IslandsSomaliaSouth AfricaSouth AsiaSouth Asia (IDA & IBRD)South SudanSpainSri LankaSt. Kitts and NevisSt. LuciaSt. Vincent and the GrenadinesSub-Saharan Africa Sub-Saharan Africa (excluding high income)Sub-Saharan Africa (IDA & IBRD countries)SudanSurinameSwazilandSwedenSwitzerlandSyrian Arab RepublicTajikistanTanzaniaThailandTimor-LesteTogoTongaTrinidad and TobagoTunisiaTurkeyTurkmenistanTurks and Caicos IslandsUgandaUkraineUnited Arab EmiratesUnited KingdomUnited StatesUpper middle incomeUruguayUzbekistanVanuatuVenezuela, RBVietnamWest Bank and GazaWorldYemen, Rep.ZambiaZimbabwe Linha do tempo:
Nesta escala de tempo está apresentado um gráfico de 1961 ano até 2014 ano Fragile and conflict affected situations. Dados de 1960 ano ausente. O número de observações reais por data: 54.
Fonte (nome):
Indicadores de desenvolvimento mundial
Fonte (organização):
Carbon Dioxide Information Analysis Center, Environmental Sciences Division, Oak Ridge National Laboratory, Tennessee, United States.
Categorias:
Climate Change, Environment
Foi atualizado:
23 abr 2017 ano
Indicadores de alterações dos valores ao longo dos anos
Mínimo:
2.619
1 jan 2009 ano
Máximo:
13.973
1 jan 1965 ano
Na data de observação
Valor
Mudança absoluta
A alteração em relação ao valor anterior
1 jan 1961 ano
8.363
+8.363
0.0%
1 jan 1962 ano
7.804
-0.559
-6.69%
1 jan 1963 ano
7.246
-0.558
-7.15%
1 jan 1964 ano
5.91
-1.336
-18.44%
1 jan 1965 ano
13.973
+8.063
136.44%
1 jan 1966 ano
11.102
-2.871
-20.55%
1 jan 1967 ano
10.77
-0.332
-2.99%
1 jan 1968 ano
8.92
-1.85
-17.18%
1 jan 1969 ano
6.741
-2.179
-24.43%
1 jan 1970 ano
7.0
+0.259
3.85%
1 jan 1971 ano
8.472
+1.472
21.03%
1 jan 1972 ano
9.029
+0.557
6.57%
1 jan 1973 ano
8.43
-0.599
-6.64%
1 jan 1974 ano
8.927
+0.498
5.9%
1 jan 1975 ano
8.893
-0.035
-0.39%
1 jan 1976 ano
7.798
-1.095
-12.31%
1 jan 1977 ano
8.595
+0.797
10.22%
1 jan 1978 ano
7.413
-1.183
-13.76%
1 jan 1979 ano
7.524
+0.112
1.51%
1 jan 1980 ano
6.048
-1.476
-19.61%
1 jan 1981 ano
6.38
+0.332
5.48%
1 jan 1982 ano
6.427
+0.047
0.74%
1 jan 1983 ano
6.478
+0.051
0.79%
1 jan 1984 ano
6.67
+0.192
2.96%
1 jan 1985 ano
6.041
-0.629
-9.43%
1 jan 1986 ano
5.856
-0.185
-3.05%
1 jan 1987 ano
7.114
+1.258
21.48%
1 jan 1988 ano
7.827
+0.712
10.01%
1 jan 1989 ano
7.171
-0.656
-8.38%
1 jan 1990 ano
7.112
-0.059
-0.82%
1 jan 1991 ano
7.824
+0.712
10.01%
1 jan 1992 ano
6.904
-0.92
-11.76%
1 jan 1993 ano
6.608
-0.296
-4.29%
1 jan 1994 ano
6.071
-0.537
-8.12%
1 jan 1995 ano
5.97
-0.101
-1.67%
1 jan 1996 ano
4.774
-1.196
-20.03%
1 jan 1997 ano
4.845
+0.071
1.5%
1 jan 1998 ano
4.403
-0.442
-9.13%
1 jan 1999 ano
4.236
-0.167
-3.78%
1 jan 2000 ano
4.623
+0.386
9.12%
1 jan 2001 ano
4.793
+0.171
3.69%
1 jan 2002 ano
4.419
-0.374
-7.8%
1 jan 2003 ano
4.25
-0.169
-3.82%
1 jan 2004 ano
3.335
-0.915
-21.53%
1 jan 2005 ano
2.821
-0.514
-15.42%
1 jan 2006 ano
3.096
+0.275
9.75%
1 jan 2007 ano
3.25
+0.154
4.98%
1 jan 2008 ano
3.537
+0.287
8.83%
1 jan 2009 ano
2.619
-0.918
-25.96%
1 jan 2010 ano
2.738
+0.119
4.55%
1 jan 2011 ano
3.139
+0.401
14.64%
1 jan 2012 ano
4.101
+0.963
30.67%
1 jan 2013 ano
3.975
-0.126
-3.07%
1 jan 2014 ano
4.089
+0.114
2.87%
Classificação de países por estatísticas atuais por anos


Comentários: