29
/pt/
pt
AIzaSyAYiBZKx7MnpbEhh9jyipgxe19OcubqV5w
April 1, 2024
203931
Myanmar
MMR
true
2
1
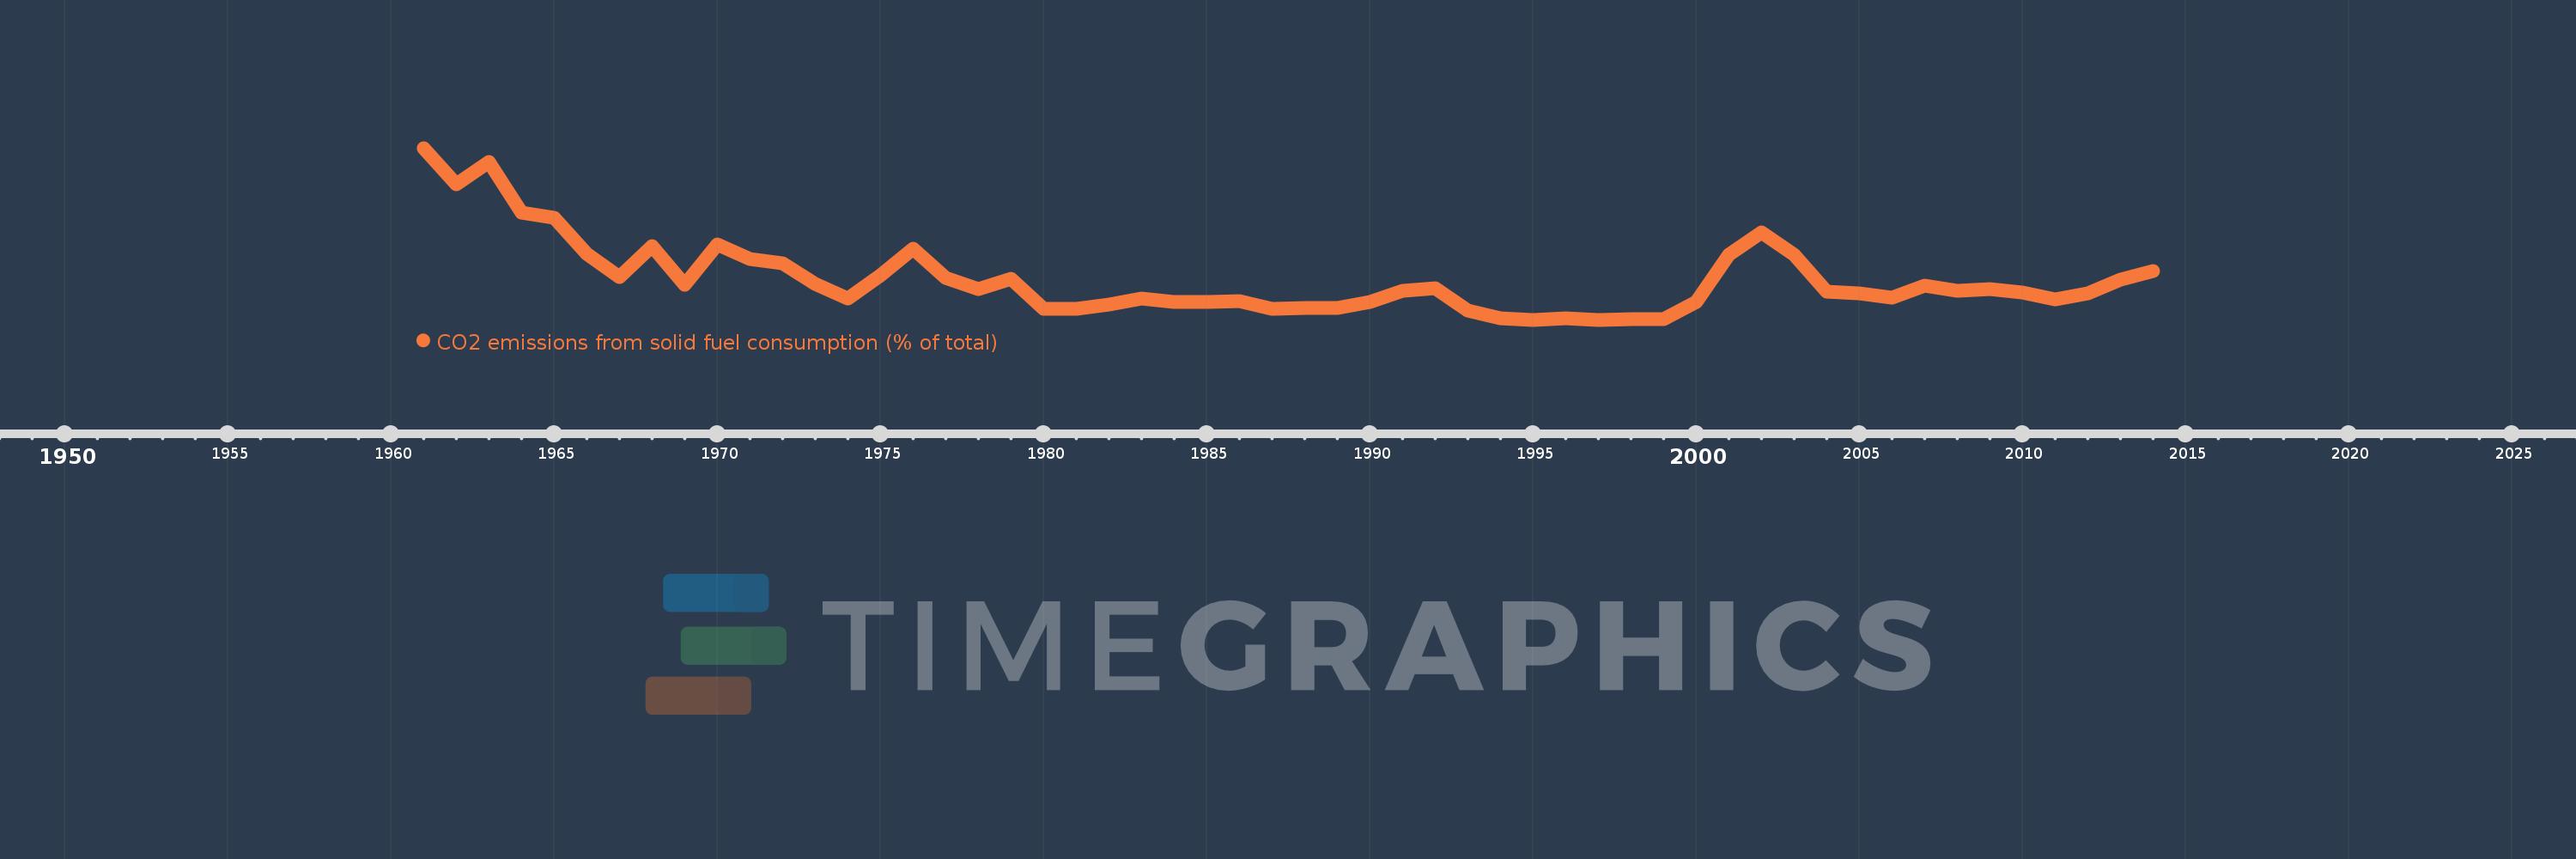
CO2 emissions from solid fuel consumption (% of total)
2014,2013,2012,2011,2010,2009,2008,2007,2006,2005,2004,2003,2002,2001,2000,1999,1998,1997,1996,1995,1994,1993,1992,1991,1990,1989,1988,1987,1986,1985,1984,1983,1982,1981,1980,1979,1978,1977,1976,1975,1974,1973,1972,1971,1970,1969,1968,1967,1966,1965,1964,1963,1962,1961
Estas estatísticas em outros países:
AfghanistanAlbaniaAlgeriaAndorraAngolaAntigua and BarbudaArab WorldArgentinaArmeniaArubaAustraliaAustriaAzerbaijanBahamas, TheBahrainBangladeshBarbadosBelarusBelgiumBelizeBeninBermudaBhutanBoliviaBosnia and HerzegovinaBotswanaBrazilBritish Virgin IslandsBrunei DarussalamBulgariaBurkina FasoBurundiCabo VerdeCambodiaCameroonCanadaCaribbean small statesCayman IslandsCentral African RepublicCentral Europe and the BalticsChadChileChinaColombiaComorosCongo, Dem. Rep.Congo, Rep.Costa RicaCote d'IvoireCroatiaCubaCuracaoCyprusCzech RepublicDenmarkDjiboutiDominicaDominican RepublicEarly-demographic dividendEast Asia & PacificEast Asia & Pacific (excluding high income)East Asia & Pacific (IDA & IBRD countries)EcuadorEgypt, Arab Rep.El SalvadorEquatorial GuineaEritreaEstoniaEthiopiaEuro areaEurope & Central AsiaEurope & Central Asia (excluding high income)Europe & Central Asia (IDA & IBRD countries)European UnionFaroe IslandsFijiFinlandFragile and conflict affected situationsFranceFrench PolynesiaGabonGambia, TheGeorgiaGermanyGhanaGibraltarGreeceGreenlandGrenadaGuatemalaGuineaGuinea-BissauGuyanaHaitiHeavily indebted poor countries (HIPC)High incomeHondurasHong Kong SAR, ChinaHungaryIBRD onlyIcelandIDA & IBRD totalIDA blendIDA onlyIDA totalIndiaIndonesiaIran, Islamic Rep.IraqIrelandIsraelItalyJamaicaJapanJordanKazakhstanKenyaKiribatiKorea, Dem. People’s Rep.Korea, Rep.KuwaitKyrgyz RepublicLao PDRLate-demographic dividendLatin America & Caribbean Latin America & Caribbean (excluding high income)Latin America & the Caribbean (IDA & IBRD countries)LatviaLeast developed countries: UN classificationLebanonLesothoLiberiaLibyaLiechtensteinLithuaniaLow & middle incomeLow incomeLower middle incomeLuxembourgMacao SAR, ChinaMacedonia, FYRMadagascarMalawiMalaysiaMaldivesMaliMaltaMarshall IslandsMauritaniaMauritiusMexicoMicronesia, Fed. Sts.Middle East & North AfricaMiddle East & North Africa (excluding high income)Middle East & North Africa (IDA & IBRD countries)Middle incomeMoldovaMongoliaMontenegroMoroccoMozambiqueMyanmarNamibiaNauruNepalNetherlandsNew CaledoniaNew ZealandNicaraguaNigerNigeriaNorth AmericaNorwayOECD membersOmanOther small statesPacific island small statesPakistanPalauPanamaPapua New GuineaParaguayPeruPhilippinesPolandPortugalPost-demographic dividendPre-demographic dividendQatarRomaniaRussian FederationRwandaSamoaSao Tome and PrincipeSaudi ArabiaSenegalSerbiaSeychellesSierra LeoneSingaporeSint Maarten (Dutch part)Slovak RepublicSloveniaSmall statesSolomon IslandsSomaliaSouth AfricaSouth AsiaSouth Asia (IDA & IBRD)South SudanSpainSri LankaSt. Kitts and NevisSt. LuciaSt. Vincent and the GrenadinesSub-Saharan Africa Sub-Saharan Africa (excluding high income)Sub-Saharan Africa (IDA & IBRD countries)SudanSurinameSwazilandSwedenSwitzerlandSyrian Arab RepublicTajikistanTanzaniaThailandTimor-LesteTogoTongaTrinidad and TobagoTunisiaTurkeyTurkmenistanTurks and Caicos IslandsUgandaUkraineUnited Arab EmiratesUnited KingdomUnited StatesUpper middle incomeUruguayUzbekistanVanuatuVenezuela, RBVietnamWest Bank and GazaWorldYemen, Rep.ZambiaZimbabwe Linha do tempo:
Nesta escala de tempo está apresentado um gráfico de 1961 ano até 2014 ano Myanmar. Dados de 1960 ano ausente. O número de observações reais por data: 54.
Fonte (nome):
Indicadores de desenvolvimento mundial
Fonte (organização):
Carbon Dioxide Information Analysis Center, Environmental Sciences Division, Oak Ridge National Laboratory, Tennessee, United States.
Categorias:
Climate Change, Environment
Foi atualizado:
23 abr 2017 ano
Indicadores de alterações dos valores ao longo dos anos
Mínimo:
0.646
1 jan 1995 ano
Máximo:
34.548
1 jan 1961 ano
Na data de observação
Valor
Mudança absoluta
A alteração em relação ao valor anterior
1 jan 1961 ano
34.548
+34.548
0.0%
1 jan 1962 ano
27.298
-7.249
-20.98%
1 jan 1963 ano
31.807
+4.508
16.51%
1 jan 1964 ano
21.836
-9.971
-31.35%
1 jan 1965 ano
20.769
-1.067
-4.88%
1 jan 1966 ano
13.575
-7.194
-34.64%
1 jan 1967 ano
9.008
-4.567
-33.65%
1 jan 1968 ano
15.198
+6.19
68.72%
1 jan 1969 ano
7.509
-7.688
-50.59%
1 jan 1970 ano
15.507
+7.998
106.51%
1 jan 1971 ano
12.629
-2.878
-18.56%
1 jan 1972 ano
11.782
-0.847
-6.71%
1 jan 1973 ano
7.784
-3.997
-33.93%
1 jan 1974 ano
4.906
-2.878
-36.97%
1 jan 1975 ano
9.333
+4.427
90.23%
1 jan 1976 ano
14.628
+5.295
56.73%
1 jan 1977 ano
8.907
-5.721
-39.11%
1 jan 1978 ano
6.662
-2.245
-25.21%
1 jan 1979 ano
8.677
+2.015
30.25%
1 jan 1980 ano
2.804
-5.873
-67.69%
1 jan 1981 ano
2.787
-0.017
-0.6%
1 jan 1982 ano
3.641
+0.854
30.65%
1 jan 1983 ano
4.846
+1.205
33.09%
1 jan 1984 ano
4.19
-0.656
-13.53%
1 jan 1985 ano
4.074
-0.117
-2.79%
1 jan 1986 ano
4.317
+0.243
5.97%
1 jan 1987 ano
2.754
-1.563
-36.21%
1 jan 1988 ano
2.948
+0.194
7.04%
1 jan 1989 ano
2.939
-0.009
-0.31%
1 jan 1990 ano
4.191
+1.252
42.61%
1 jan 1991 ano
6.432
+2.242
53.49%
1 jan 1992 ano
6.93
+0.498
7.74%
1 jan 1993 ano
2.476
-4.454
-64.28%
1 jan 1994 ano
0.961
-1.515
-61.19%
1 jan 1995 ano
0.646
-0.315
-32.78%
1 jan 1996 ano
0.948
+0.302
46.82%
1 jan 1997 ano
0.657
-0.291
-30.73%
1 jan 1998 ano
0.685
+0.028
4.22%
1 jan 1999 ano
0.681
-0.004
-0.54%
1 jan 2000 ano
4.088
+3.407
500.44%
1 jan 2001 ano
13.486
+9.398
229.87%
1 jan 2002 ano
17.949
+4.463
33.09%
1 jan 2003 ano
13.421
-4.528
-25.23%
1 jan 2004 ano
6.108
-7.313
-54.49%
1 jan 2005 ano
5.868
-0.24
-3.92%
1 jan 2006 ano
5.058
-0.81
-13.8%
1 jan 2007 ano
7.42
+2.362
46.69%
1 jan 2008 ano
6.38
-1.04
-14.02%
1 jan 2009 ano
6.622
+0.242
3.79%
1 jan 2010 ano
5.95
-0.672
-10.15%
1 jan 2011 ano
4.688
-1.262
-21.21%
1 jan 2012 ano
5.822
+1.134
24.19%
1 jan 2013 ano
8.534
+2.712
46.58%
1 jan 2014 ano
10.241
+1.707
20.01%
Classificação de países por estatísticas atuais por anos


Comentários: