29
/pt/
pt
AIzaSyAYiBZKx7MnpbEhh9jyipgxe19OcubqV5w
April 1, 2024
169716
Korea, Rep.
KOR
true
2
1
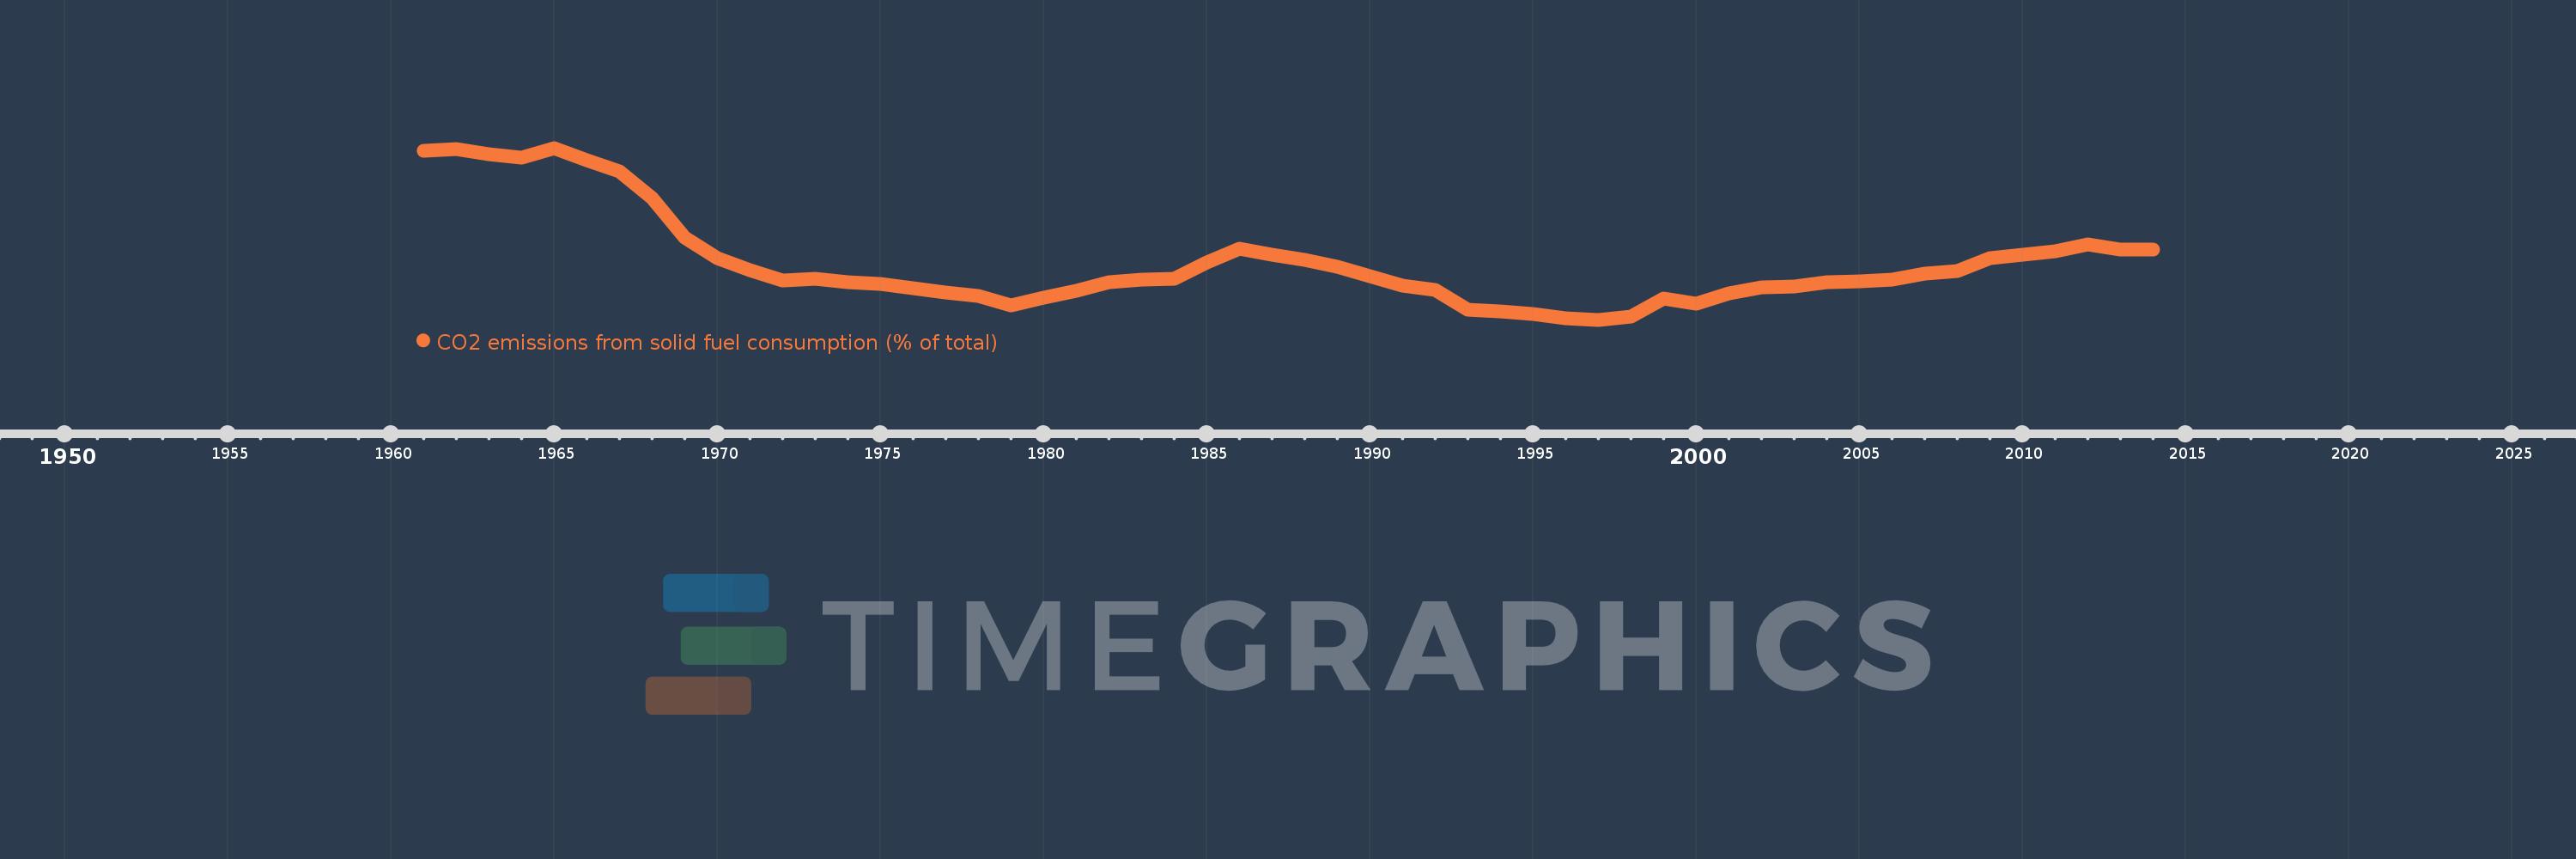
CO2 emissions from solid fuel consumption (% of total)
2014,2013,2012,2011,2010,2009,2008,2007,2006,2005,2004,2003,2002,2001,2000,1999,1998,1997,1996,1995,1994,1993,1992,1991,1990,1989,1988,1987,1986,1985,1984,1983,1982,1981,1980,1979,1978,1977,1976,1975,1974,1973,1972,1971,1970,1969,1968,1967,1966,1965,1964,1963,1962,1961
Estas estatísticas em outros países:
AfghanistanAlbaniaAlgeriaAndorraAngolaAntigua and BarbudaArab WorldArgentinaArmeniaArubaAustraliaAustriaAzerbaijanBahamas, TheBahrainBangladeshBarbadosBelarusBelgiumBelizeBeninBermudaBhutanBoliviaBosnia and HerzegovinaBotswanaBrazilBritish Virgin IslandsBrunei DarussalamBulgariaBurkina FasoBurundiCabo VerdeCambodiaCameroonCanadaCaribbean small statesCayman IslandsCentral African RepublicCentral Europe and the BalticsChadChileChinaColombiaComorosCongo, Dem. Rep.Congo, Rep.Costa RicaCote d'IvoireCroatiaCubaCuracaoCyprusCzech RepublicDenmarkDjiboutiDominicaDominican RepublicEarly-demographic dividendEast Asia & PacificEast Asia & Pacific (excluding high income)East Asia & Pacific (IDA & IBRD countries)EcuadorEgypt, Arab Rep.El SalvadorEquatorial GuineaEritreaEstoniaEthiopiaEuro areaEurope & Central AsiaEurope & Central Asia (excluding high income)Europe & Central Asia (IDA & IBRD countries)European UnionFaroe IslandsFijiFinlandFragile and conflict affected situationsFranceFrench PolynesiaGabonGambia, TheGeorgiaGermanyGhanaGibraltarGreeceGreenlandGrenadaGuatemalaGuineaGuinea-BissauGuyanaHaitiHeavily indebted poor countries (HIPC)High incomeHondurasHong Kong SAR, ChinaHungaryIBRD onlyIcelandIDA & IBRD totalIDA blendIDA onlyIDA totalIndiaIndonesiaIran, Islamic Rep.IraqIrelandIsraelItalyJamaicaJapanJordanKazakhstanKenyaKiribatiKorea, Dem. People’s Rep.Korea, Rep.KuwaitKyrgyz RepublicLao PDRLate-demographic dividendLatin America & Caribbean Latin America & Caribbean (excluding high income)Latin America & the Caribbean (IDA & IBRD countries)LatviaLeast developed countries: UN classificationLebanonLesothoLiberiaLibyaLiechtensteinLithuaniaLow & middle incomeLow incomeLower middle incomeLuxembourgMacao SAR, ChinaMacedonia, FYRMadagascarMalawiMalaysiaMaldivesMaliMaltaMarshall IslandsMauritaniaMauritiusMexicoMicronesia, Fed. Sts.Middle East & North AfricaMiddle East & North Africa (excluding high income)Middle East & North Africa (IDA & IBRD countries)Middle incomeMoldovaMongoliaMontenegroMoroccoMozambiqueMyanmarNamibiaNauruNepalNetherlandsNew CaledoniaNew ZealandNicaraguaNigerNigeriaNorth AmericaNorwayOECD membersOmanOther small statesPacific island small statesPakistanPalauPanamaPapua New GuineaParaguayPeruPhilippinesPolandPortugalPost-demographic dividendPre-demographic dividendQatarRomaniaRussian FederationRwandaSamoaSao Tome and PrincipeSaudi ArabiaSenegalSerbiaSeychellesSierra LeoneSingaporeSint Maarten (Dutch part)Slovak RepublicSloveniaSmall statesSolomon IslandsSomaliaSouth AfricaSouth AsiaSouth Asia (IDA & IBRD)South SudanSpainSri LankaSt. Kitts and NevisSt. LuciaSt. Vincent and the GrenadinesSub-Saharan Africa Sub-Saharan Africa (excluding high income)Sub-Saharan Africa (IDA & IBRD countries)SudanSurinameSwazilandSwedenSwitzerlandSyrian Arab RepublicTajikistanTanzaniaThailandTimor-LesteTogoTongaTrinidad and TobagoTunisiaTurkeyTurkmenistanTurks and Caicos IslandsUgandaUkraineUnited Arab EmiratesUnited KingdomUnited StatesUpper middle incomeUruguayUzbekistanVanuatuVenezuela, RBVietnamWest Bank and GazaWorldYemen, Rep.ZambiaZimbabwe Linha do tempo:
Nesta escala de tempo está apresentado um gráfico de 1961 ano até 2014 ano Korea, Rep.. Dados de 1960 ano ausente. O número de observações reais por data: 54.
Fonte (nome):
Indicadores de desenvolvimento mundial
Fonte (organização):
Carbon Dioxide Information Analysis Center, Environmental Sciences Division, Oak Ridge National Laboratory, Tennessee, United States.
Categorias:
Climate Change, Environment
Foi atualizado:
23 abr 2017 ano
Indicadores de alterações dos valores ao longo dos anos
Mínimo:
27.468
1 jan 1997 ano
Máximo:
82.588
1 jan 1965 ano
Na data de observação
Valor
Mudança absoluta
A alteração em relação ao valor anterior
1 jan 1961 ano
81.624
+81.624
0.0%
1 jan 1962 ano
82.353
+0.729
0.89%
1 jan 1963 ano
80.624
-1.729
-2.1%
1 jan 1964 ano
79.548
-1.076
-1.33%
1 jan 1965 ano
82.588
+3.04
3.82%
1 jan 1966 ano
78.589
-3.999
-4.84%
1 jan 1967 ano
75.113
-3.476
-4.42%
1 jan 1968 ano
66.649
-8.464
-11.27%
1 jan 1969 ano
53.87
-12.78
-19.17%
1 jan 1970 ano
47.146
-6.724
-12.48%
1 jan 1971 ano
43.322
-3.824
-8.11%
1 jan 1972 ano
40.194
-3.128
-7.22%
1 jan 1973 ano
40.671
+0.477
1.19%
1 jan 1974 ano
39.377
-1.294
-3.18%
1 jan 1975 ano
39.055
-0.322
-0.82%
1 jan 1976 ano
37.522
-1.533
-3.93%
1 jan 1977 ano
36.251
-1.271
-3.39%
1 jan 1978 ano
35.087
-1.163
-3.21%
1 jan 1979 ano
32.08
-3.008
-8.57%
1 jan 1980 ano
34.561
+2.481
7.73%
1 jan 1981 ano
36.676
+2.115
6.12%
1 jan 1982 ano
39.448
+2.773
7.56%
1 jan 1983 ano
40.421
+0.972
2.46%
1 jan 1984 ano
40.727
+0.306
0.76%
1 jan 1985 ano
45.909
+5.182
12.72%
1 jan 1986 ano
50.13
+4.22
9.19%
1 jan 1987 ano
48.289
-1.841
-3.67%
1 jan 1988 ano
46.581
-1.708
-3.54%
1 jan 1989 ano
44.432
-2.149
-4.61%
1 jan 1990 ano
41.49
-2.941
-6.62%
1 jan 1991 ano
38.41
-3.081
-7.42%
1 jan 1992 ano
36.911
-1.499
-3.9%
1 jan 1993 ano
30.589
-6.322
-17.13%
1 jan 1994 ano
30.186
-0.404
-1.32%
1 jan 1995 ano
29.21
-0.975
-3.23%
1 jan 1996 ano
28.026
-1.184
-4.05%
1 jan 1997 ano
27.468
-0.558
-1.99%
1 jan 1998 ano
28.507
+1.038
3.78%
1 jan 1999 ano
34.205
+5.698
19.99%
1 jan 2000 ano
32.681
-1.524
-4.45%
1 jan 2001 ano
35.802
+3.121
9.55%
1 jan 2002 ano
37.878
+2.076
5.8%
1 jan 2003 ano
38.237
+0.359
0.95%
1 jan 2004 ano
39.474
+1.237
3.24%
1 jan 2005 ano
39.895
+0.42
1.07%
1 jan 2006 ano
40.42
+0.525
1.32%
1 jan 2007 ano
42.395
+1.975
4.89%
1 jan 2008 ano
43.087
+0.693
1.63%
1 jan 2009 ano
47.093
+4.005
9.3%
1 jan 2010 ano
48.292
+1.2
2.55%
1 jan 2011 ano
49.347
+1.055
2.18%
1 jan 2012 ano
51.731
+2.384
4.83%
1 jan 2013 ano
50.078
-1.652
-3.19%
1 jan 2014 ano
49.966
-0.113
-0.22%
Classificação de países por estatísticas atuais por anos


Comentários: